Flowchart Emissions: Difference between revisions
Jump to navigation
Jump to search

No edit summary |
(CSV import) |
||
| Line 1: | Line 1: | ||
{{FigureTemplate | {{FigureTemplate | ||
|Figure= | |Figure=148s img13.png | ||
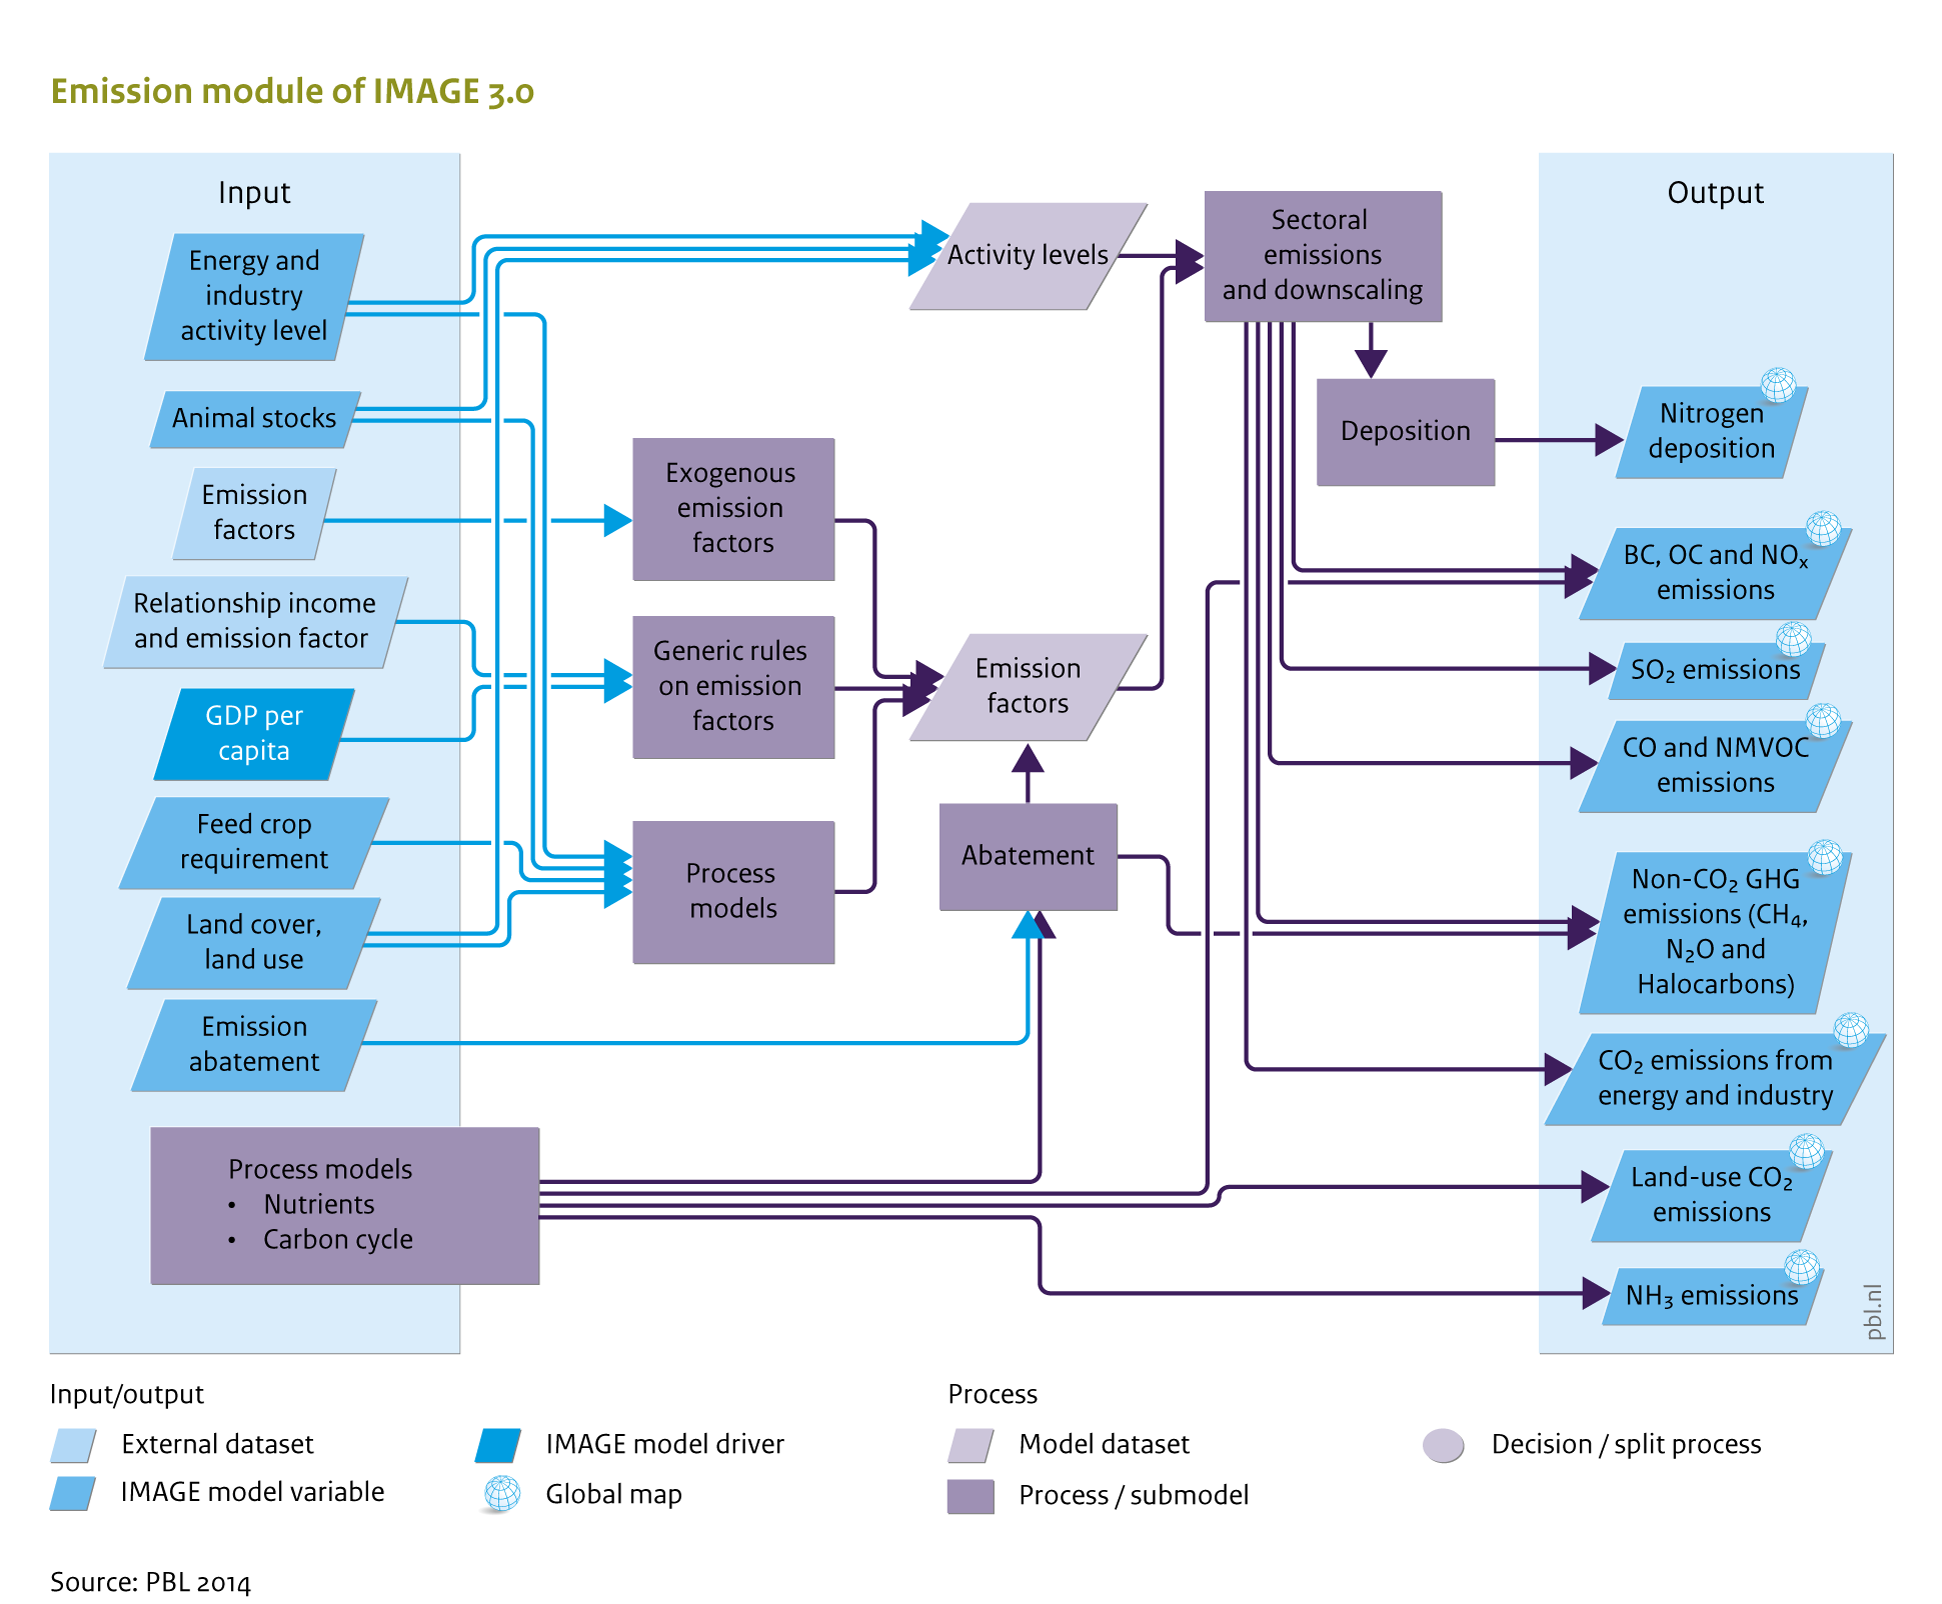
|Caption= | |Caption=Anthropogenic sources, for natural sources see Table 5.2.2. More detail on inputs and outputs, and how they link to other IMAGE components is presented at the end of this section (Emission table). | ||
|FigureType=Flowchart | |FigureType=Flowchart | ||
|OptimalSize=800 | |OptimalSize=800 | ||
|Component=Emissions; | |Component=Emissions; | ||
|AltText=Emission module of IMAGE 3.0 | |||
}} | }} | ||
Revision as of 13:43, 23 May 2014
Caption: Anthropogenic sources, for natural sources see Table 5.2.2. More detail on inputs and outputs, and how they link to other IMAGE components is presented at the end of this section (Emission table).
Figure is used on page(s): Emissions