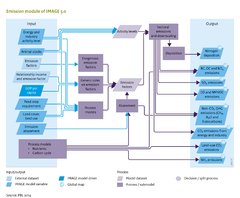
Emissions
Jump to navigation
Jump to search
Parts of Emissions
| Component is implemented in: |
Components:and
|
| Projects/Applications |
| Models/Databases |
| Key publications |
Key policy issues
- How will emissions of greenhouse gases and air pollutants develop in scenarios with and without policy interventions, such as climate policy and air pollution control?
- What synergies between climate policy and air pollution control can be identified?
Introduction
Emissions of greenhouse gases and air pollutants are major contributors to environmental impacts, such as climate change, acidification, eutrophication, urban air pollution and water pollution. These emissions stem from anthropogenic and natural sources. Anthropogenic sources include energy production and consumption, industrial processes, agriculture and land-use change, while natural sources include wetlands, oceans and unmanaged land. Better understanding the drivers of these emissions and the impact of abatement measures is needed in developing policy interventions to reduce long-term environmental impacts.
Input/Output Table
Input Emissions component
| IMAGE model drivers and variables | Description | Source |
|---|---|---|
| GDP per capita | Gross Domestic Product per capita, measured as the market value of all goods and services produced in a region in a year, and is used in the IMAGE framework as a generic indicator of economic activity. | Drivers |
| Energy and industry activity level | Activity levels in the energy and industrial sector, per process and energy carrier, for example, the combustion of petrol for transport or the production of crude oil. | Energy conversion, Energy demand, Energy supply |
| Emission abatement | Reduction in emission factors as a function of Climate policy. | Climate policy |
| Land cover, land use - grid | Multi-dimensional map describing all aspects of land cover and land use per grid cell, such as type of natural vegetation, crop and grass fraction, crop management, fertiliser and manure input, livestock density. | Land cover and land use |
| Animal stocks | Number of animals per category: non-dairy cattle; dairy cattle; pigs; sheep and goats; poultry. | Livestock systems |
| Feed crop requirement | Total amount of feed required for the production of animal products. Grass and fodder species are consumed by grazing animals only (dairy and non-dairy cattle, sheep and goats), while pigs and poultry are fed feed crops and other feedstuffs. | Livestock systems |
| External datasets | Description | Source |
|---|---|---|
| Emission factors | Exogenous emission factors per sector, activity and gas, mostly based on the EDGAR database. | EDGAR database |
| Relationship income and emission factor | Relationship between GDP and emission factors. |
Output Emissions component
| IMAGE model variables | Description | Use |
|---|---|---|
| SO2 emissions | SO2 emissions, per source (e.g. fossil fuel burning, deforestation). | |
| CO and NMVOC emissions | Emissions from CO and NMVOC. | |
| Non-CO2 GHG emissions (CH4, N2O and Halocarbons) | Non-CO2 GHG emissions (CH4, N2O, Halocarbons). | |
| CO2 emission from energy and industry | CO2 emission from energy and industry. | |
| Nitrogen deposition - grid | Deposition of nitrogen. | |
| BC, OC and NOx emissions | Emissions of BC, OC and NOx per year. |
