Terrestrial biodiversity: Difference between revisions
Jump to navigation
Jump to search
No edit summary |
No edit summary |
||
| Line 2: | Line 2: | ||
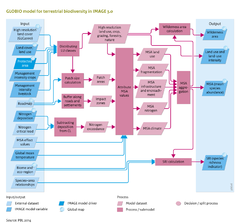
|InputVar=Management intensity crops; Management intensity livestock; Nitrogen deposition - grid; Global mean temperature; Protected area - grid; | |InputVar=Management intensity crops; Management intensity livestock; Nitrogen deposition - grid; Global mean temperature; Protected area - grid; | ||
|Parameter=Species-area relations; Road-map - grid; Nitrogen critical load; Biome and ecoregion - grid; MSA effect values; High resolution land cover (GLC2000) - grid; | |Parameter=Species-area relations; Road-map - grid; Nitrogen critical load; Biome and ecoregion - grid; MSA effect values; High resolution land cover (GLC2000) - grid; | ||
|OutputVar=Wilderness area - grid; MSA (mean species abundance) - grid; SRI (species richness index) - grid; | |OutputVar=Wilderness area - grid; MSA (mean species abundance) - grid; SRI (species richness index) - grid; Land use and land-use intensity - grid ; | ||
|Description=model intro | |Description=model intro | ||
|ComponentCode=TB | |ComponentCode=TB | ||
Revision as of 16:08, 31 March 2014
Parts of Terrestrial biodiversity
| Component is implemented in: |
|
| Projects/Applications |
| Key publications |
| References |
Key policy issues
- What is the future rate of terrestrial biodiversity loss in the absence of additional policies and measures?
- What are the key pressure factors causing biodiversity loss?
- How will nature conservation policies and measures to reduce the key pressure factors of biodiversity loss contribute to meeting the targets of the UN Convention on Biological Diversity (CBD)?