Baseline figure Energy supply: Difference between revisions
Jump to navigation
Jump to search
No edit summary |
(CSV import) |
||
| Line 1: | Line 1: | ||
{{FigureTemplate | {{FigureTemplate | ||
|Figure=036x img13.png | |Figure=036x img13.png | ||
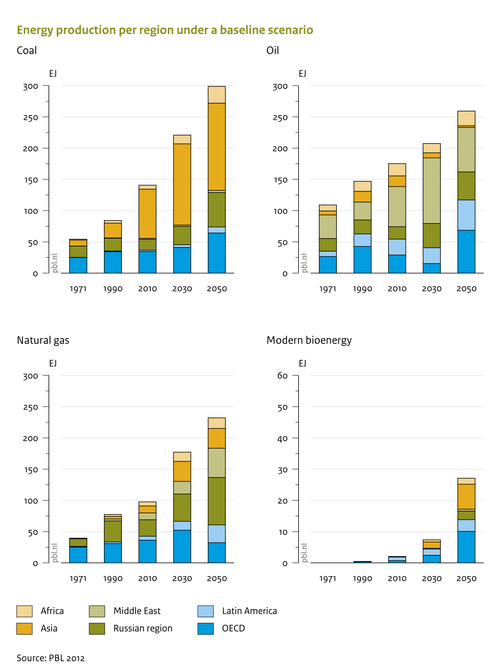
|AltText=Energy production per region | |AltText=Energy production per region under a baseline scenario | ||
|Caption= | |Caption=Over time the share of most important energy producers for different forms of energy changes. This has implications for energy security. | ||
|FigureType=Baseline figure | |FigureType=Baseline figure | ||
|OptimalSize=500 | |OptimalSize=500 | ||
|Component=Energy supply; | |Component=Energy supply; | ||
}} | }} | ||
Revision as of 14:43, 23 May 2014
Caption: Over time the share of most important energy producers for different forms of energy changes. This has implications for energy security.
Figure is used on page(s): Energy supply