Ecosystem services/Description: Difference between revisions
Jump to navigation
Jump to search
No edit summary |
No edit summary |
||
| Line 1: | Line 1: | ||
{{ComponentDescriptionTemplate | {{ComponentDescriptionTemplate | ||
|Reference=Maes et al., 2012; Egoh et al., 2008; Egoh et al., 2009; O'Farrell et al., 2010; Costanza et al., 1997; TEEB, 2010b; UNEP-WCMC, 2011; Burkhard et al., 2012;Nelson, 2008; EFI, 2007; Sea around us project, 2013; FAO, 2013b; Alcamo et al., 2003; Biemans et al., 2011; Vörösmarty et al., 2000; Crossman et al., 2013; Hootsmans et al., 2001; Gallai et al., 2009; Steffan-Dewenter and Tscharntke, 1999; Klein et al., 2011; Kleijn and Langevelde, 2006; Morandin et al., 2007; Schulp and Alkemade, 2011; Thies et al., 2003; Boccaccio and Petacchi, 2009; Rusch et al., 2011; Hawkins and Cornell, 1994; Bianchi et al., 2005; UNISDR, 2011; IPCC, 2012; Bell and Tobin, 2007; Van Asselen et al., 2013; | |Reference=Maes et al., 2012; Egoh et al., 2008; Egoh et al., 2009; O'Farrell et al., 2010; Costanza et al., 1997; TEEB, 2010b; UNEP-WCMC, 2011; Burkhard et al., 2012;Nelson, 2008; EFI, 2007; Sea around us project, 2013; FAO, 2013b; Alcamo et al., 2003; Biemans et al., 2011; Vörösmarty et al., 2000; Crossman et al., 2013; Hootsmans et al., 2001; Gallai et al., 2009; Steffan-Dewenter and Tscharntke, 1999; Klein et al., 2011; Kleijn and Langevelde, 2006; Morandin et al., 2007; Schulp and Alkemade, 2011; Thies et al., 2003; Boccaccio and Petacchi, 2009; Rusch et al., 2011; Hawkins and Cornell, 1994; Bianchi et al., 2005; UNISDR, 2011; IPCC, 2012; Bell and Tobin, 2007; Van Asselen et al., 2013; | ||
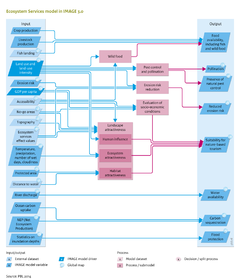
|Description=The supply of ecosystem services is quantified using other models in the IMAGE 3.0 framework, and where necessary combined with relationships between environmental variables and ecosystem services supply, derived from literature reviews (Figure Flowchart). | |Description=The supply of ecosystem services is quantified using other models in the IMAGE 3.0 framework, and where necessary combined with relationships between environmental variables and ecosystem services supply, derived from literature reviews (Figure Flowchart). | ||
| Line 95: | Line 95: | ||
Erosion is the loss of topsoil by wind and water, and is a natural process. However, agricultural practices can accelerate erosion rates, reducing productivity and leading to loss of arable land. The model considers topsoil erosion related to water and agricultural practices (Component [[Land degradation]]). | Erosion is the loss of topsoil by wind and water, and is a natural process. However, agricultural practices can accelerate erosion rates, reducing productivity and leading to loss of arable land. The model considers topsoil erosion related to water and agricultural practices (Component [[Land degradation]]). | ||
The erosion risk depends on topography, precipitation and agricultural practices, including crop type (see Component [[Land | The erosion risk depends on topography, precipitation and agricultural practices, including crop type (see Component [[Land degradation]]). The risk can be reduced by natural vegetation serving as buffer zones, erosion prevention strips and uphill soil retention cover. To determine the supply of ecosystem services, the erosion risk index from IMAGE is linearly reduced by the percentage of natural elements in a grid cell, derived from the land use and intensity map from GLOBIO (see Component [[Land degradation]]). | ||
Erosion prevention is needed in all cultivated areas. The ecosystem services budget indicates whether natural vegetation is sufficient to protect the area from erosion risk. According to ([[Hootsmans et al., 2001]]), an erosion index value greater than 0.15 indicates moderate erosion risk, and an index value in excess of 0.30 indicates high erosion risk. It is assumed the ecosystem services are adequate when the nature-corrected index value is below 0.15. | Erosion prevention is needed in all cultivated areas. The ecosystem services budget indicates whether natural vegetation is sufficient to protect the area from erosion risk. According to ([[Hootsmans et al., 2001]]), an erosion index value greater than 0.15 indicates moderate erosion risk, and an index value in excess of 0.30 indicates high erosion risk. It is assumed the ecosystem services are adequate when the nature-corrected index value is below 0.15. | ||
Revision as of 07:00, 20 May 2014
Parts of Ecosystem services/Description