Water/Description: Difference between revisions
< Water
Jump to navigation
Jump to search
No edit summary |
No edit summary |
||
| Line 1: | Line 1: | ||
{{ComponentDescriptionTemplate | {{ComponentDescriptionTemplate | ||
|Reference=Nilsson et al., 2005; Alcamo et al., 2003; Davies et al., 2013; Pastor et al., submitted; Bondeau et al., 2007; Sitch et al., 2003; Gerten et al., 2004; Rost et al., 2008; Biemans et al., 2013; | |Reference=Nilsson et al., 2005; Alcamo et al., 2003; Davies et al., 2013; Pastor et al., submitted; Bondeau et al., 2007; Sitch et al., 2003; Gerten et al., 2004; Rost et al., 2008; Biemans et al., 2013; | ||
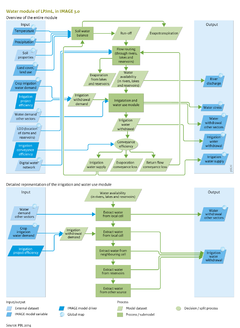
|Description=In IMAGE, the hydrological cycle is represented by LPJmL ([[Sitch et al., 2003]]; [[Bondeau et al., 2007]]; [[Gerten et al., 2013]]), which simulates the global hydrological cycle as part of the dynamics of natural vegetation and agricultural production systems. Because LPJmL is linked to IMAGE, there is consistency in the way the [[Carbon cycle and natural vegetation|carbon cycle, natural vegetation]] dynamics, [[Crops and grass|crop growth and production]], [[land-use allocation]] and the water balance can be modelled. | |Description=In IMAGE, the hydrological cycle is represented by LPJmL ([[Sitch et al., 2003]]; [[Bondeau et al., 2007]]; [[Gerten et al., 2013]]), which simulates the global hydrological cycle as part of the dynamics of natural vegetation and agricultural production systems. Because LPJmL is linked to IMAGE, there is consistency in the way the [[Carbon cycle and natural vegetation|carbon cycle, natural vegetation]] dynamics, [[Crops and grass|crop growth and production]], [[land-use allocation]] and the water balance can be modelled. | ||
| Line 14: | Line 14: | ||
Precipitation reaching the soil (throughfall, precipitation minus interception) either accumulates as snow or infiltrates into the soil. Snowmelt is calculated using a simple degree-day method ([[Gerten et al., 2004]]). The soil is parameterised as a bucket model. The status of soil moisture of the two soil layers is updated daily, accounting for throughfall, snowmelt, evapotranspiration, percolation and runoff. Percolation rates for the two soil layers depend on soil type and decline exponentially with soil moisture. Total runoff is calculated as water in excess of field capacity from the two soil layers and water percolating through the second soil layer. The current version of LPJmL has no explicit representation of groundwater recharge, but a groundwater scheme is under development. The daily (subsurface) runoff includes the renewable fraction of groundwater, but without any time delay. | Precipitation reaching the soil (throughfall, precipitation minus interception) either accumulates as snow or infiltrates into the soil. Snowmelt is calculated using a simple degree-day method ([[Gerten et al., 2004]]). The soil is parameterised as a bucket model. The status of soil moisture of the two soil layers is updated daily, accounting for throughfall, snowmelt, evapotranspiration, percolation and runoff. Percolation rates for the two soil layers depend on soil type and decline exponentially with soil moisture. Total runoff is calculated as water in excess of field capacity from the two soil layers and water percolating through the second soil layer. The current version of LPJmL has no explicit representation of groundwater recharge, but a groundwater scheme is under development. The daily (subsurface) runoff includes the renewable fraction of groundwater, but without any time delay. | ||
All runoff is routed daily through a gridded river network, representing a system of rivers, natural lakes and reservoirs, using a simple routing algorithm ([[Rost et al., 2008]]). Local runoff is added to surface water storage in the cell, and subsequently flows downstream at a constant flow velocity of 1 m s-1 until reaching a lake or reservoir. Water accumulates in lakes and reservoirs, and outflow depends on actual storage relative to the maximum storage capacity (for lakes) and the operational purpose of the reservoir ([[Biemans et al., 2011]]). For man-made reservoirs, see further below([[Biemans et al., 2011]]) | All runoff is routed daily through a gridded river network, representing a system of rivers, natural lakes and reservoirs, using a simple routing algorithm ([[Rost et al., 2008]]). Local runoff is added to surface water storage in the cell, and subsequently flows downstream at a constant flow velocity of 1 m s-1 until reaching a lake or reservoir. Water accumulates in lakes and reservoirs, and outflow depends on actual storage relative to the maximum storage capacity (for lakes) and the operational purpose of the reservoir ([[Biemans et al., 2011]]). For man-made reservoirs, see further below ([[Biemans et al., 2011]]) | ||
===Supply and demand for irrigation water=== | ===Supply and demand for irrigation water=== | ||
| Line 41: | Line 41: | ||
The impacts of water stress differ per sector, but the indicators described above do not provide deeper insight into these impacts. In addition to the general water stress indicators, the model also considers production reduction in irrigated agriculture due to limited water availability as an indicator of agricultural water stress ([[Biemans, 2012]]). | The impacts of water stress differ per sector, but the indicators described above do not provide deeper insight into these impacts. In addition to the general water stress indicators, the model also considers production reduction in irrigated agriculture due to limited water availability as an indicator of agricultural water stress ([[Biemans, 2012]]). | ||
}} | }} | ||
Revision as of 15:03, 20 May 2014
Parts of Water/Description
| Component is implemented in: |
|
| Related IMAGE components |
| Projects/Applications |
| Key publications |
| References |