Carbon cycle and natural vegetation/Description: Difference between revisions
Jump to navigation
Jump to search
Oostenrijr (talk | contribs) No edit summary |
Oostenrijr (talk | contribs) m (Text replace - "CO2 " to "CO<sub>2</sub>") |
||
| Line 13: | Line 13: | ||
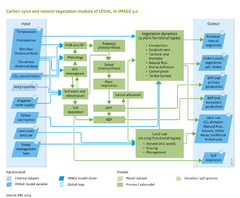
Allocation of newly established biomass is computed in annual time steps for perennial plants (natural grasses, trees) and in daily time steps for annual plants (crops). Allocation to plant organs (represented by a carbon pool for each) distinguishes up to four living plant carbon pools, depending on plant type. For grasses, the model distinguishes carbon pools of leaves and roots only, and for trees, there are two additional woody carbon pools (hardwood and sapwood). For agricultural crops, the pools are categorised as leaves, roots, storage organs, stems, and a mobile reserve pool. | Allocation of newly established biomass is computed in annual time steps for perennial plants (natural grasses, trees) and in daily time steps for annual plants (crops). Allocation to plant organs (represented by a carbon pool for each) distinguishes up to four living plant carbon pools, depending on plant type. For grasses, the model distinguishes carbon pools of leaves and roots only, and for trees, there are two additional woody carbon pools (hardwood and sapwood). For agricultural crops, the pools are categorised as leaves, roots, storage organs, stems, and a mobile reserve pool. | ||
To simulate mineralisation rates of soil organic carbon, the model distinguishes three soil carbon pools for litter, fast soil organic matter (10-year turnover rate) and slow soil organic matter (100-year turnover rate). All carbon from harvested products (crops, grass, biofuels) is assumed to be released to the atmosphere as | To simulate mineralisation rates of soil organic carbon, the model distinguishes three soil carbon pools for litter, fast soil organic matter (10-year turnover rate) and slow soil organic matter (100-year turnover rate). All carbon from harvested products (crops, grass, biofuels) is assumed to be released to the atmosphere as CO<sub>2</sub>after consumption (food, feed, energy) in the same year. Residues are either left in the fields to enter the litter pool or are removed to subsequently decompose. | ||
During wood harvesting, a proportion of the plant pools is cut down and harvested, as determined in the [[forest management]] model . The waste is left to enter the soil litter pool as dead biomass. Three classes of wood products are distinguished to account for differences in lifespan: | During wood harvesting, a proportion of the plant pools is cut down and harvested, as determined in the [[forest management]] model . The waste is left to enter the soil litter pool as dead biomass. Three classes of wood products are distinguished to account for differences in lifespan: | ||
| Line 23: | Line 23: | ||
===Model linkage and simulation procedure=== | ===Model linkage and simulation procedure=== | ||
The [[LPJmL model]] has multiple links to other IMAGE components and uses IMAGE data on climate, atmospheric | The [[LPJmL model]] has multiple links to other IMAGE components and uses IMAGE data on climate, atmospheric CO<sub>2</sub>concentration, land use (including wood demand), and timber use and deforestation (cutting and burning). LPJmL supplies other IMAGE components with information on annual carbon fluxes, net CO<sub>2</sub>exchange between biosphere and atmosphere, size of carbon pools, and natural land cover (biome) classes (see [[Carbon_cycle_and_natural_vegetation|Input/output Table]] at Introduction part ). | ||
LPJmL and IMAGE are linked via an interface and starts in the simulation year of 1970. Before 1970, vegetation and soil carbon pools need to be initialised. This is done by using LPJmL first in a 1000-year spin up to initialise the natural ecosystems and their carbon pools and fluxes, followed by a 390-year spin up, in which agricultural land is gradually expanded based on historical [[HYDE database|HYDE]] land-use data ([[Klein Goldewijk et al., 2011]]). The pool sizes of timber products for 1970 are based on literature estimates ([[Lauk et al., 2012]]). | LPJmL and IMAGE are linked via an interface and starts in the simulation year of 1970. Before 1970, vegetation and soil carbon pools need to be initialised. This is done by using LPJmL first in a 1000-year spin up to initialise the natural ecosystems and their carbon pools and fluxes, followed by a 390-year spin up, in which agricultural land is gradually expanded based on historical [[HYDE database|HYDE]] land-use data ([[Klein Goldewijk et al., 2011]]). The pool sizes of timber products for 1970 are based on literature estimates ([[Lauk et al., 2012]]). | ||
Revision as of 09:24, 1 July 2014
Parts of Carbon cycle and natural vegetation/Description
| Component is implemented in: |
|
| Related IMAGE components |
| Models/Databases |
| Key publications |
| References |