Aquatic biodiversity: Difference between revisions
Oostenrijr (talk | contribs) No edit summary |
Oostenrijr (talk | contribs) No edit summary |
||
| Line 7: | Line 7: | ||
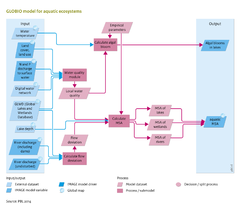
|Parameter=GLWD (global lakes and wetlands database) - grid; Lake depth - grid; Digital water network - grid; Empirical MSA effect values; Water temperature - grid; | |Parameter=GLWD (global lakes and wetlands database) - grid; Lake depth - grid; Digital water network - grid; Empirical MSA effect values; Water temperature - grid; | ||
|OutputVar=Aquatic MSA - grid; Algal blooms in lakes; | |OutputVar=Aquatic MSA - grid; Algal blooms in lakes; | ||
| | |FrameworkElementType=impact component | ||
|ComponentCode=AB | |||
|AggregatedComponent=Impacts | |||
}} | |||
<div class="page_standard"> | |||
==Introduction== | |||
Inland aquatic ecosystems, including rivers, natural lakes, reservoirs, and wetlands, cover about 8 to 9% of the Earth’s continental surface ([[Lehner and Döll, 2004]]). The wetland area has declined considerably in the last century ([[Moser et al., 1998]]). Freshwater systems are dynamic and spatially interrelated , and the drivers of biodiversity loss partly differ from those of terrestrial ecosystems (see Section 7.2). Therefore, the effects of human-induced changes on the biodiversity of freshwater aquatic ecosystems is covered in a separate model in the IMAGE framework. | |||
The [[GLOBIO model]] for aquatic ecosystems, GLOBIO aquatic, is based on a catchment approach to account for the composite effect of pressure factors on various parts of a catchment. The main drivers included are land use and nutrient loss within catchments, water flow deviations, and climate change. Changes in these drivers in future scenarios as calculated by the IMAGE model are used as input to GLOBIO aquatic. | The [[GLOBIO model]] for aquatic ecosystems, GLOBIO aquatic, is based on a catchment approach to account for the composite effect of pressure factors on various parts of a catchment. The main drivers included are land use and nutrient loss within catchments, water flow deviations, and climate change. Changes in these drivers in future scenarios as calculated by the IMAGE model are used as input to GLOBIO aquatic. | ||
The biodiversity indicators are comparable with those in the GLOBIO model for terrestrial ecosystems: species richness and biodiversity intactness, which is the mean abundance of original species relative to their abundance in undisturbed ecosystems ({{abbrTemplate|MSA}}). Similar to its terrestrial counterpart, the driver-impact-relationships for aquatic biodiversity are based on meta-analyses of empirical data from the literature. In addition to biodiversity indicators, the model calculates the occurrence of harmful algal blooms in lakes. | The biodiversity indicators are comparable with those in the GLOBIO model for terrestrial ecosystems: species richness and biodiversity intactness, which is the mean abundance of original species relative to their abundance in undisturbed ecosystems ({{abbrTemplate|MSA}}). Similar to its terrestrial counterpart, the driver-impact-relationships for aquatic biodiversity are based on meta-analyses of empirical data from the literature. In addition to biodiversity indicators, the model calculates the occurrence of harmful algal blooms in lakes. | ||
</div> | |||
Revision as of 12:48, 15 November 2018
Parts of Aquatic biodiversity
| Component is implemented in: |
|
| Projects/Applications |
| Models/Databases |
| Key publications |
| References |
Key policy issues
- How will the biodiversity in freshwater bodies develop in the absence of additional policies and measures?
- What are the key pressure factors causing loss of aquatic biodiversity?
- How will policies and measures to reduce the key pressure factors contribute to meeting the internationally agreed targets of the UN Convention on Biological Diversity (CBD)?
Introduction
Introduction
Inland aquatic ecosystems, including rivers, natural lakes, reservoirs, and wetlands, cover about 8 to 9% of the Earth’s continental surface (Lehner and Döll, 2004). The wetland area has declined considerably in the last century (Moser et al., 1998). Freshwater systems are dynamic and spatially interrelated , and the drivers of biodiversity loss partly differ from those of terrestrial ecosystems (see Section 7.2). Therefore, the effects of human-induced changes on the biodiversity of freshwater aquatic ecosystems is covered in a separate model in the IMAGE framework.
The GLOBIO model for aquatic ecosystems, GLOBIO aquatic, is based on a catchment approach to account for the composite effect of pressure factors on various parts of a catchment. The main drivers included are land use and nutrient loss within catchments, water flow deviations, and climate change. Changes in these drivers in future scenarios as calculated by the IMAGE model are used as input to GLOBIO aquatic.
The biodiversity indicators are comparable with those in the GLOBIO model for terrestrial ecosystems: species richness and biodiversity intactness, which is the mean abundance of original species relative to their abundance in undisturbed ecosystems (MSA). Similar to its terrestrial counterpart, the driver-impact-relationships for aquatic biodiversity are based on meta-analyses of empirical data from the literature. In addition to biodiversity indicators, the model calculates the occurrence of harmful algal blooms in lakes.