Baseline figure Agricultural economy: Difference between revisions
Jump to navigation
Jump to search

m (Text replace - "FigurePage" to "Figure") |
No edit summary |
||
| Line 4: | Line 4: | ||
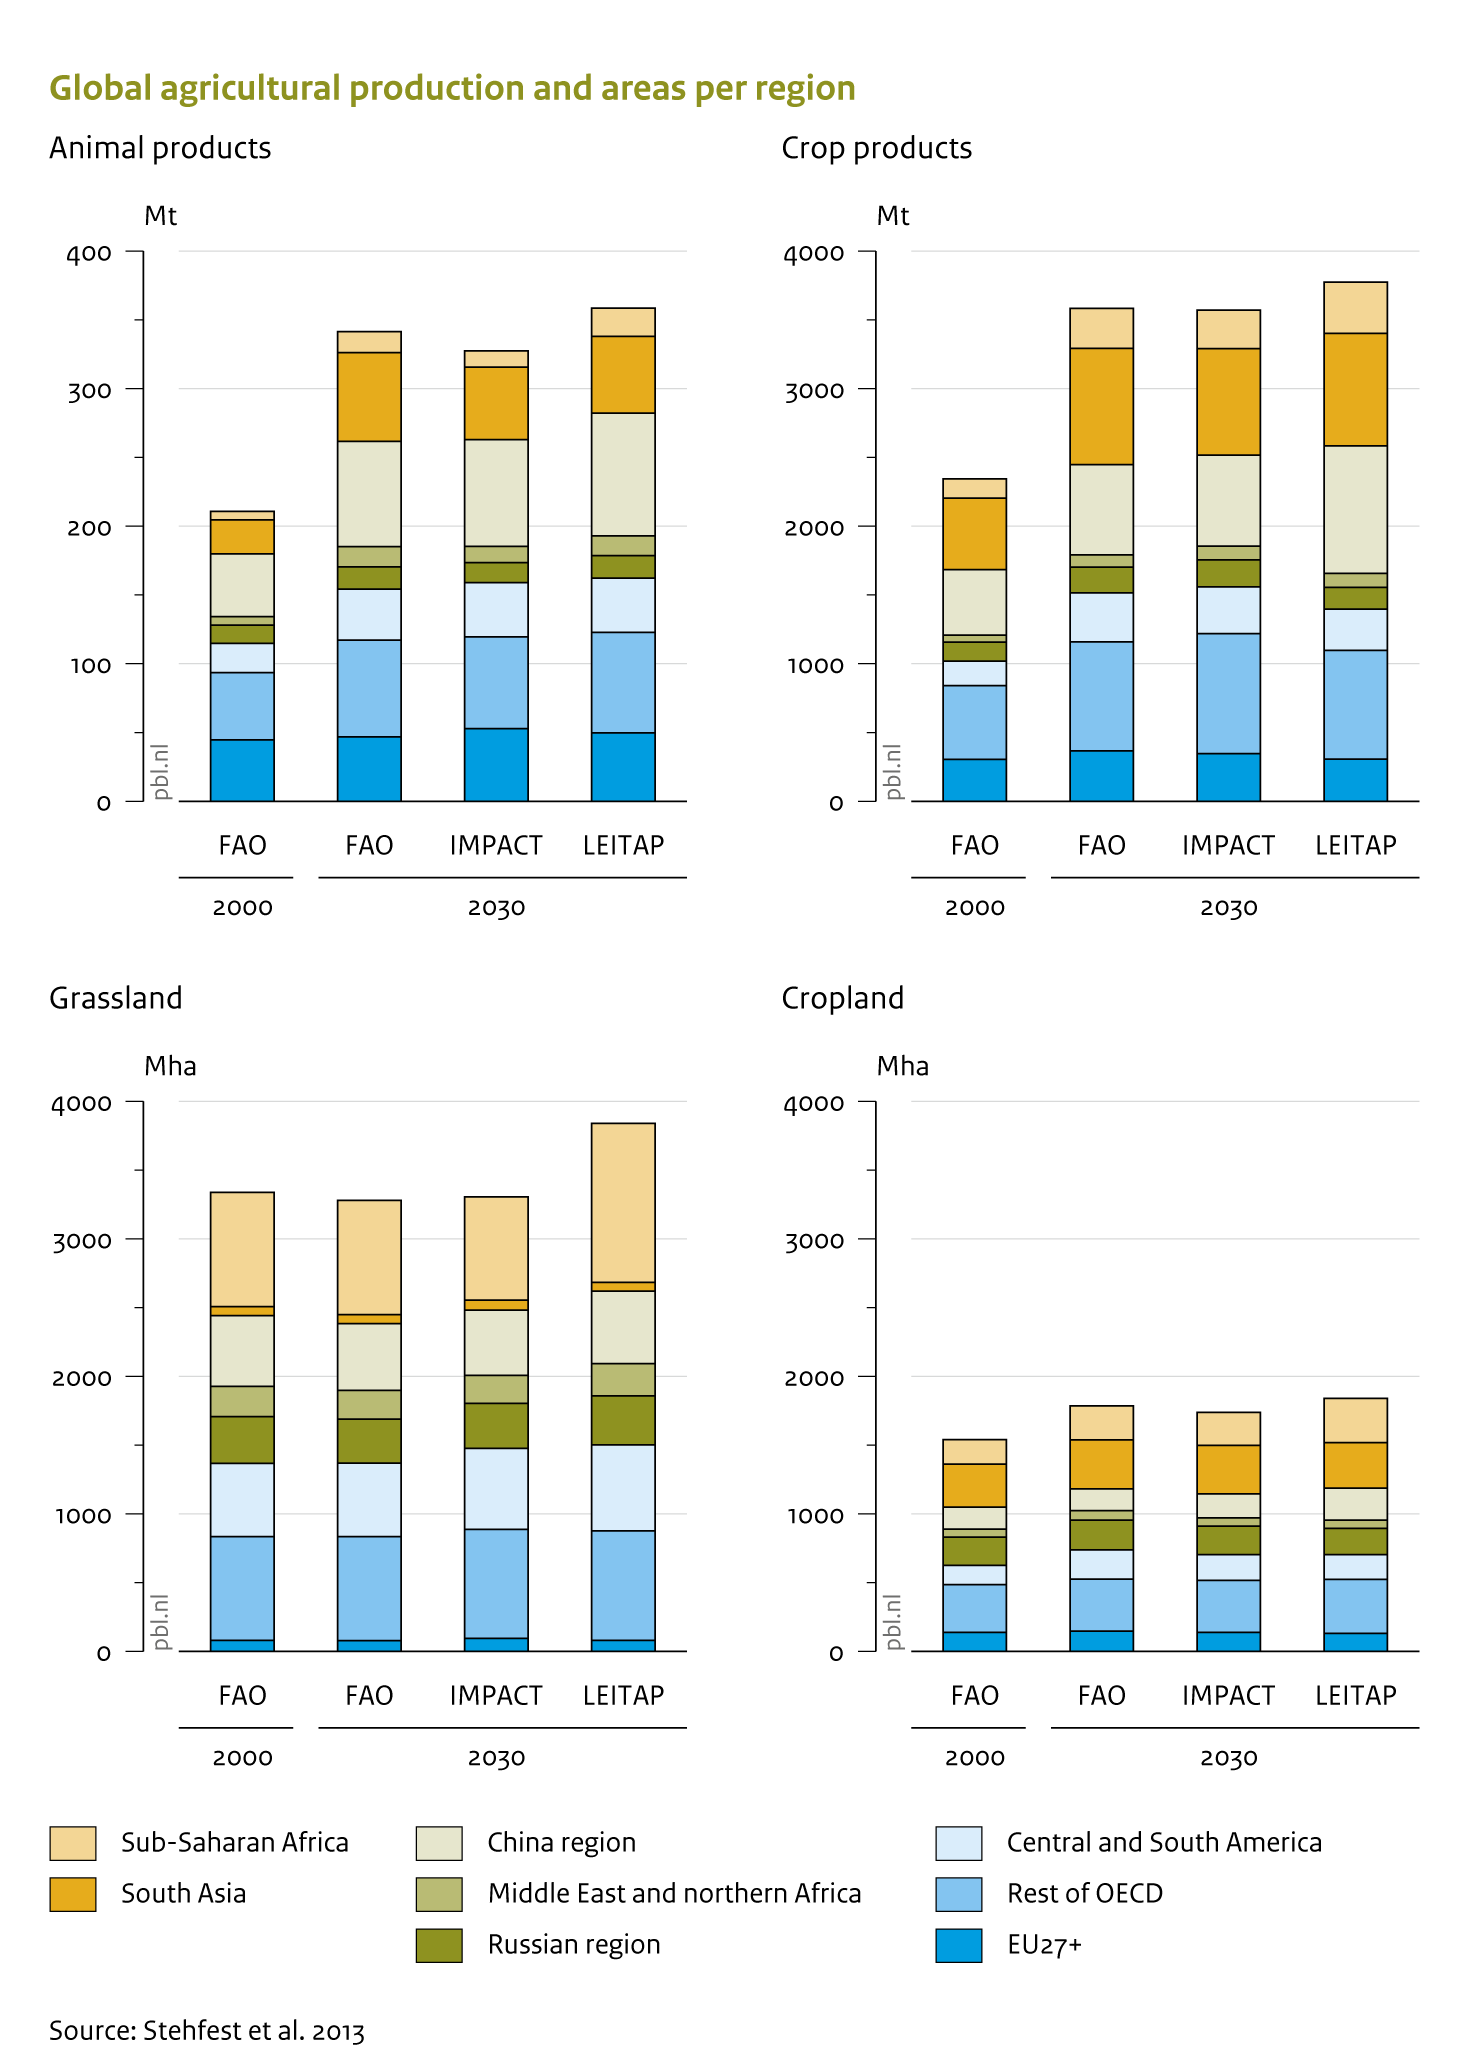
|Caption=Production of animal and crop products (top) and cropland and grassland areas (bottom) in 2000 and in 2030 according to an implementation of FAO projections (Bruinsma 2003) in IMAGE, and according to IMPACT and MAGNET projections (Stehfest et al. 2013). | |Caption=Production of animal and crop products (top) and cropland and grassland areas (bottom) in 2000 and in 2030 according to an implementation of FAO projections (Bruinsma 2003) in IMAGE, and according to IMPACT and MAGNET projections (Stehfest et al. 2013). | ||
|FigureType=Baseline figure | |FigureType=Baseline figure | ||
|OptimalSize= | |OptimalSize=500 | ||
|Component=Agricultural economy and forestry; | |Component=Agricultural economy and forestry; | ||
}} | }} | ||
Revision as of 14:54, 16 December 2013
Caption: Production of animal and crop products (top) and cropland and grassland areas (bottom) in 2000 and in 2030 according to an implementation of FAO projections (Bruinsma 2003) in IMAGE, and according to IMPACT and MAGNET projections (Stehfest et al. 2013).
Figure is used on page(s): Agricultural economy