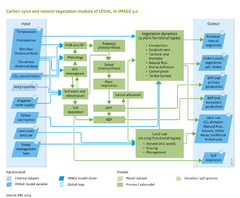
Carbon cycle and natural vegetation/Policy issues: Difference between revisions
Jump to navigation
Jump to search
No edit summary |
No edit summary |
||
| Line 4: | Line 4: | ||
An example of an application of this model is that of its use to assess some of the important uncertainties about the terrestrial carbon balance (([[Müller et al., a (unpublished)]])) . That study included multiple values for climate sensitivity, including multiple climate patterns (defining the distribution of temperature and precipitation changes over the globe and with considerable variations between individual general circulation models (GCMs)) for two different socio-economic scenarios. These experiments showed a possible shift in the terrestrial biosphere from sink to source under a broad range of global mean temperature changes (2.3–6.8 oC until 2100), and atmospheric CO2 concentrations (475–936 ppm). Interestingly, for both temperature change and atmospheric CO2 concentration, there is a broad overlap between the scenarios that lead to a carbon reversal and those that do not. In fact, it is the rate of temperature increase that clearly varies between scenarios with and without a shift in carbon balance. The ‘thresholds’ rate of temperature change ranges between 0.04 oC/year and 0.08 oC/year, depending on the GCM pattern. Finally, the CO2 dynamics respond to the degree of warming (climate sensitivity). The calculations suggest that, based on the LPJmL model, the likelihood of a carbon balance shift within the 21st century increases almost linearly from ~5% under a climate sensitivity of 2.5 °C to ~90% at 5.0 °C | An example of an application of this model is that of its use to assess some of the important uncertainties about the terrestrial carbon balance (([[Müller et al., a (unpublished)]])) . That study included multiple values for climate sensitivity, including multiple climate patterns (defining the distribution of temperature and precipitation changes over the globe and with considerable variations between individual general circulation models (GCMs)) for two different socio-economic scenarios. These experiments showed a possible shift in the terrestrial biosphere from sink to source under a broad range of global mean temperature changes (2.3–6.8 oC until 2100), and atmospheric CO2 concentrations (475–936 ppm). Interestingly, for both temperature change and atmospheric CO2 concentration, there is a broad overlap between the scenarios that lead to a carbon reversal and those that do not. In fact, it is the rate of temperature increase that clearly varies between scenarios with and without a shift in carbon balance. The ‘thresholds’ rate of temperature change ranges between 0.04 oC/year and 0.08 oC/year, depending on the GCM pattern. Finally, the CO2 dynamics respond to the degree of warming (climate sensitivity). The calculations suggest that, based on the LPJmL model, the likelihood of a carbon balance shift within the 21st century increases almost linearly from ~5% under a climate sensitivity of 2.5 °C to ~90% at 5.0 °C | ||
|Example= | |Example=BESCHRIJVING FIGUUR 2 (Overmars) | ||
}} | }} | ||
Revision as of 15:11, 7 January 2014
Parts of Carbon cycle and natural vegetation/Policy issues
| Component is implemented in: |
|
| Related IMAGE components |
| Models/Databases |
| Key publications |
| References |
