Baseline figure Energy supply: Difference between revisions
Jump to navigation
Jump to search
m (Text replace - "FigurePage" to "Figure") |
No edit summary |
||
| Line 4: | Line 4: | ||
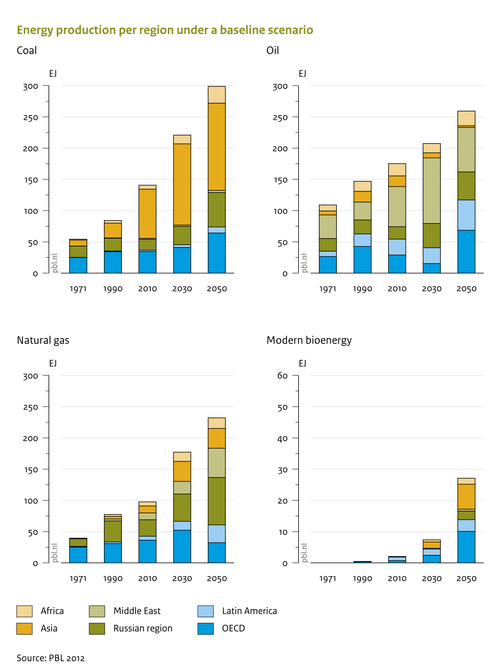
|Caption=Regional production for oil, natural gas, coal, bio-energy, nuclear and renewables in a baseline (PBL 2012) | |Caption=Regional production for oil, natural gas, coal, bio-energy, nuclear and renewables in a baseline (PBL 2012) | ||
|FigureType=Baseline figure | |FigureType=Baseline figure | ||
|OptimalSize=500 | |||
|Component=Energy supply; | |Component=Energy supply; | ||
}} | }} | ||
Revision as of 12:27, 31 March 2014
Caption: Regional production for oil, natural gas, coal, bio-energy, nuclear and renewables in a baseline (PBL 2012)
Figure is used on page(s): Energy supply