Policy intervention figure Ecosystem services: Difference between revisions
Jump to navigation
Jump to search
m (RinekeOostenrijk moved page Baseline figure EGS II to Policy intervention figure EGS without leaving a redirect) |
No edit summary |
||
| Line 3: | Line 3: | ||
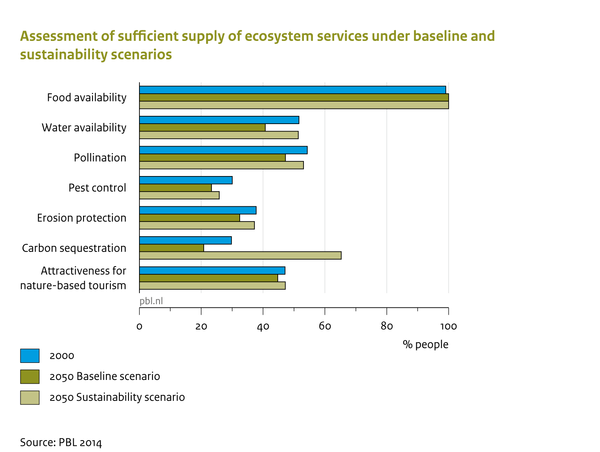
|Caption=Assessment of sufficient supply of Ecosystem Services in the baseline as a map for the year 2000 (top), and aggregated to groups of services for 2000 and 2050 (bottom). | |Caption=Assessment of sufficient supply of Ecosystem Services in the baseline as a map for the year 2000 (top), and aggregated to groups of services for 2000 and 2050 (bottom). | ||
|FigureType=Baseline figure | |FigureType=Baseline figure | ||
|OptimalSize=600 | |||
|Component=Ecosystem goods and services; | |Component=Ecosystem goods and services; | ||
}} | }} | ||
Revision as of 08:33, 7 April 2014
Caption: Assessment of sufficient supply of Ecosystem Services in the baseline as a map for the year 2000 (top), and aggregated to groups of services for 2000 and 2050 (bottom).
Figure is used on page(s): Ecosystem services