Baseline figure Land-use allocation: Difference between revisions
Jump to navigation
Jump to search
m (moved Baseline figure LUA to Baseline figure AS: Text replace - "LUA" to "AS") |
No edit summary |
||
| Line 1: | Line 1: | ||
{{FigureTemplate | {{FigureTemplate | ||
|Figure=059X_img13.png | |Figure=059X_img13.png | ||
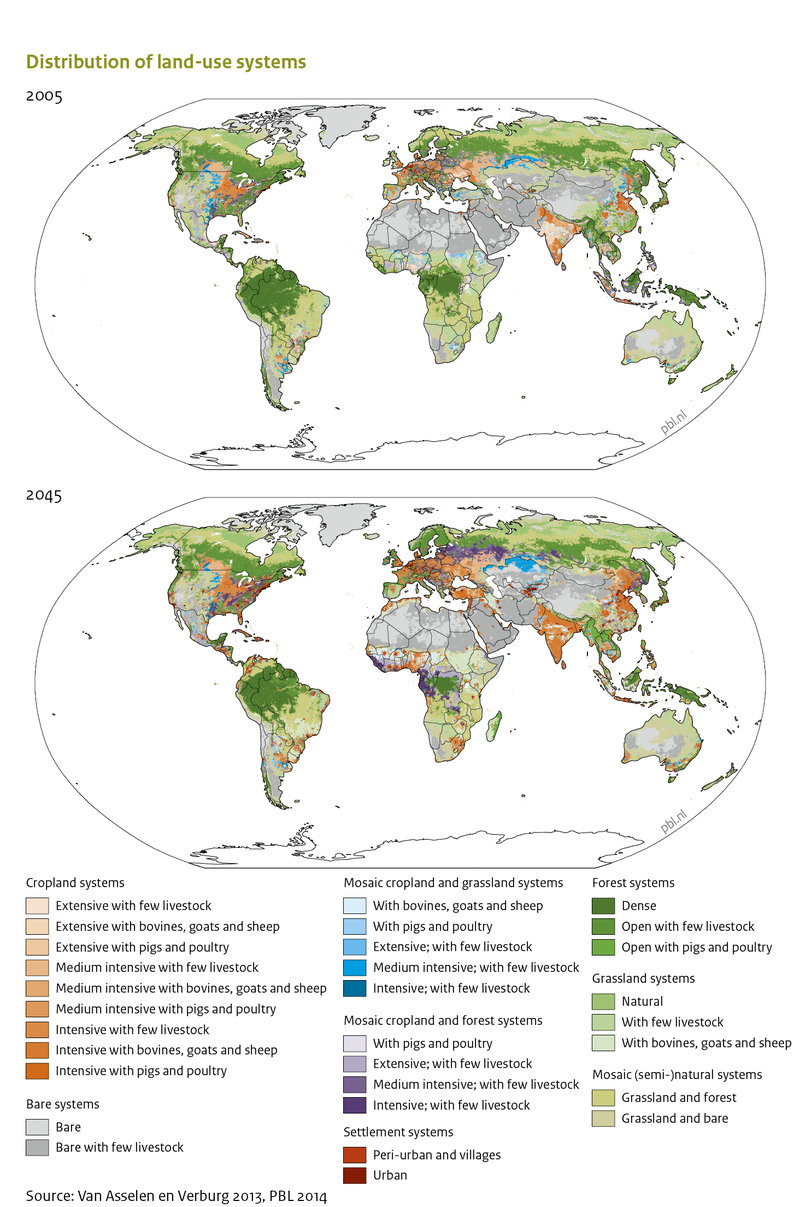
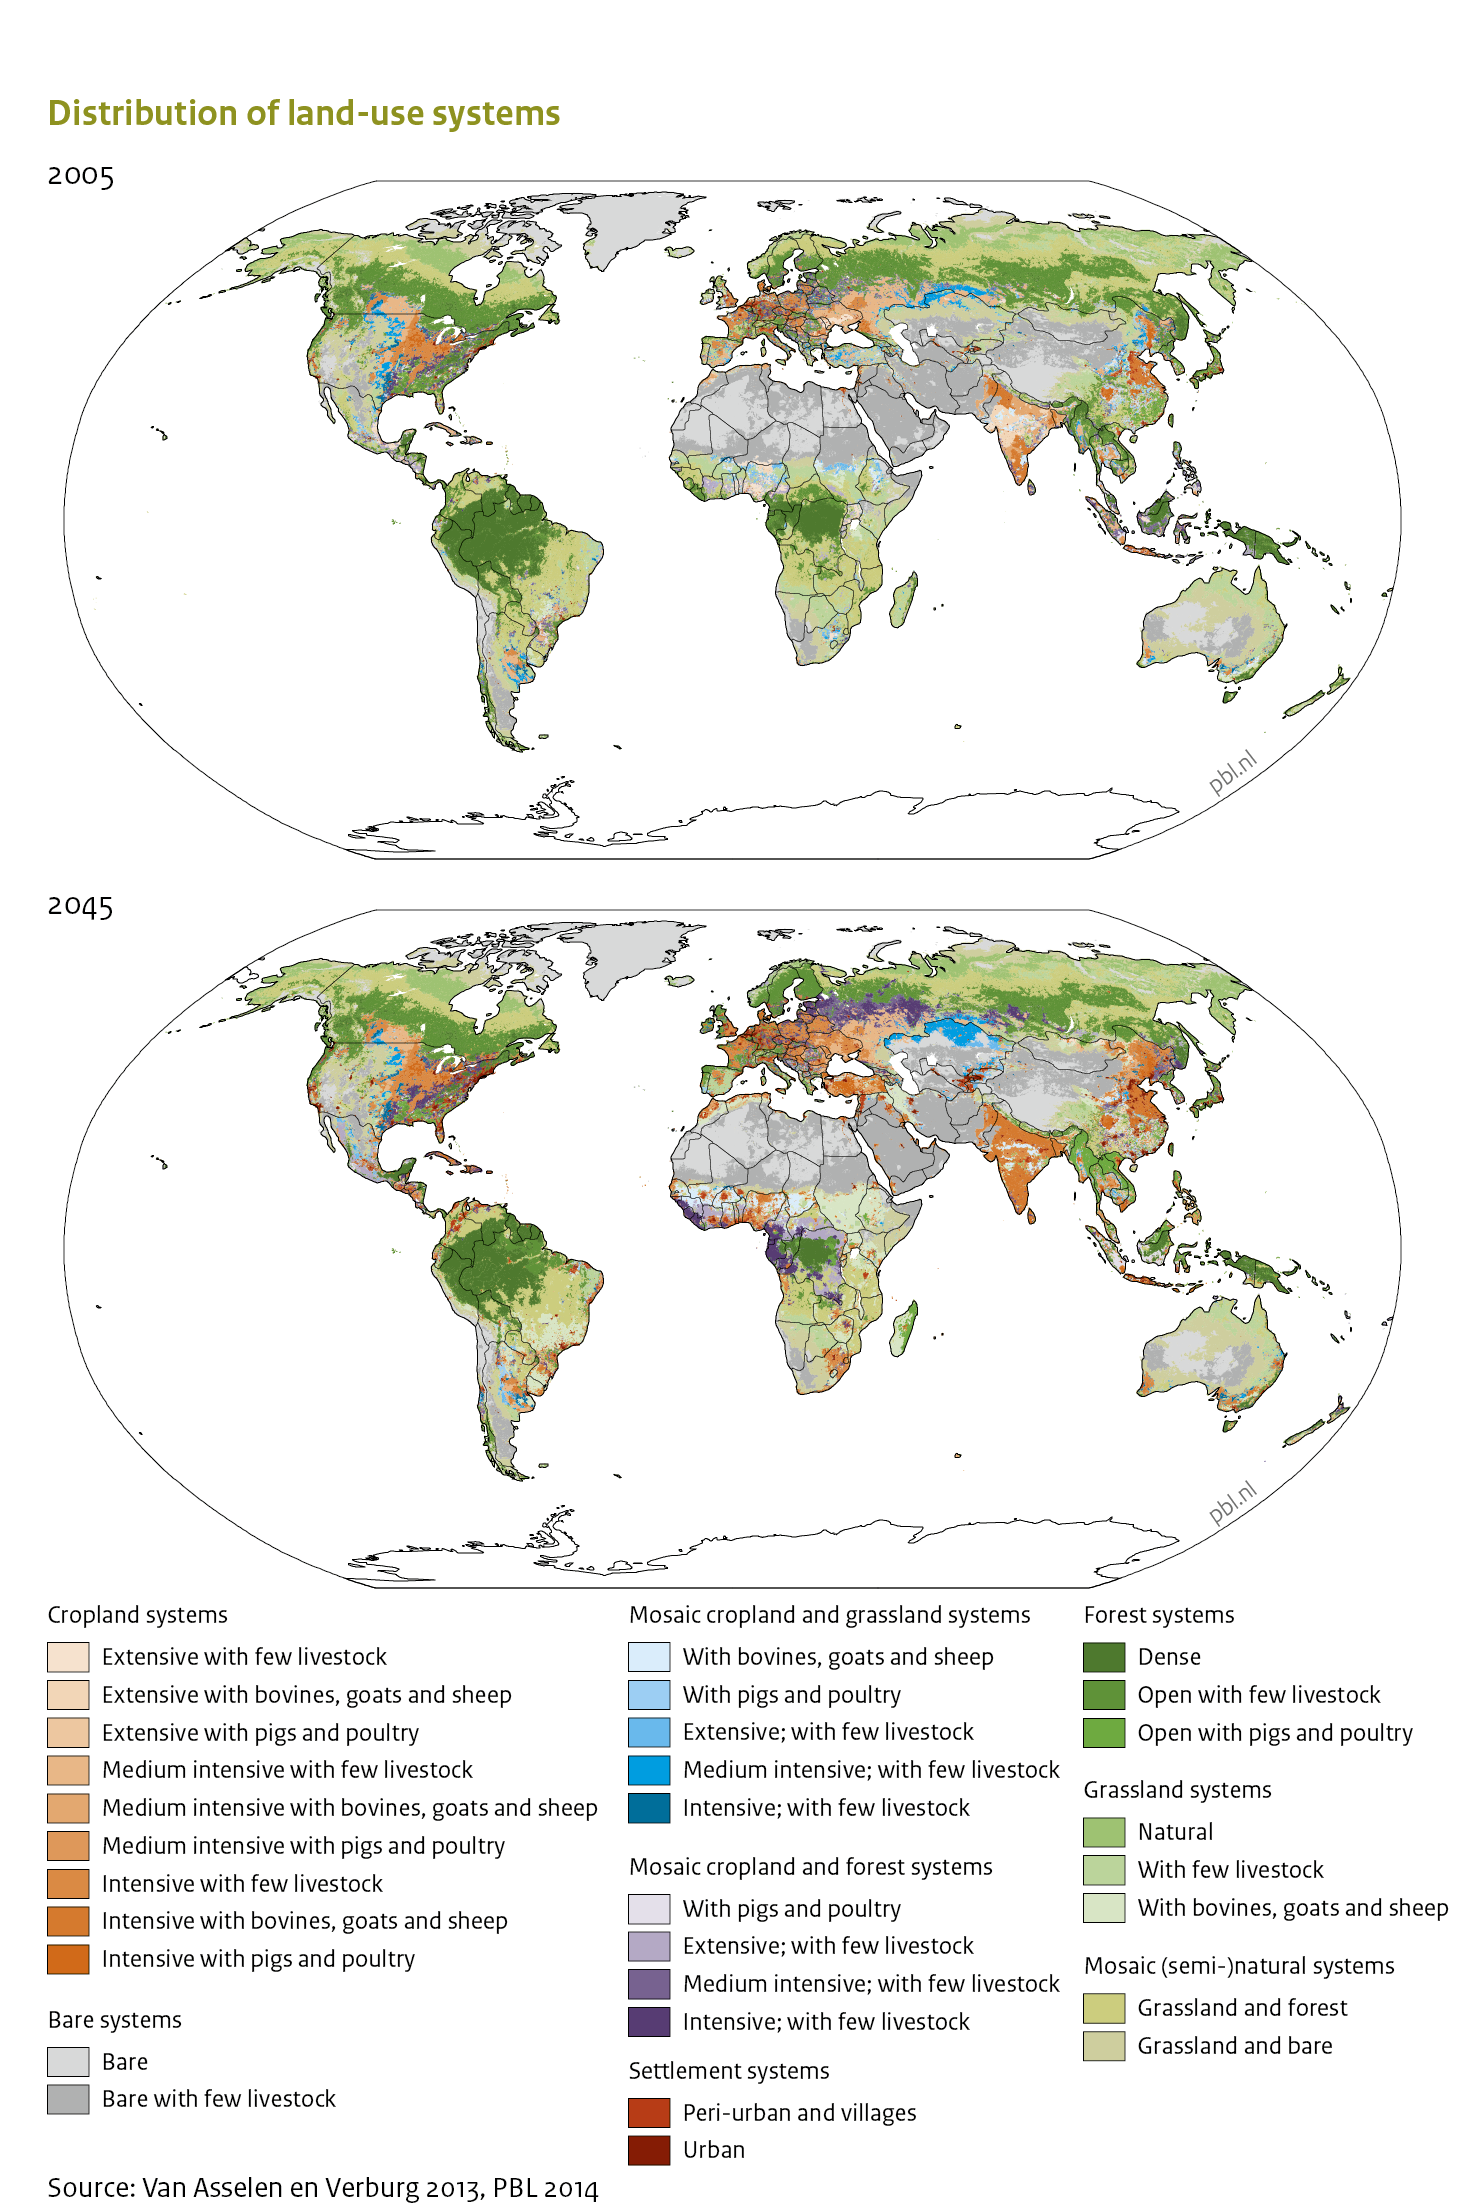
|Caption=Distribution of Land use in the year 2005 (top) and in 2050 (below), adopted from van Asselen et al. 2012. | |Caption=Distribution of Land use in the year 2005 (top) and in 2050 (below), adopted from van Asselen et al. 2012. | ||
|FigureType=Baseline figure | |FigureType=Baseline figure | ||
|Component=Agricultural systems; | |OptimalSize=800 | ||
|Component=Agricultural systems; | |||
}} | }} | ||
Revision as of 12:58, 5 May 2014
Caption: Distribution of Land use in the year 2005 (top) and in 2050 (below), adopted from van Asselen et al. 2012.
Figure is used on page(s): IMAGE framework summary/Interaction, Land-use allocation, Model description IMAGE-CLUMondo