Terrestrial biodiversity: Difference between revisions
Jump to navigation
Jump to search
No edit summary |
No edit summary |
||
| Line 1: | Line 1: | ||
{{ComponentTemplate2 | {{ComponentTemplate2 | ||
|Application=Millennium Ecosystem Assessment - MA (2005) project; | |||
|KeyReference=Alkemade et al., 2009; PBL, 2010; | |||
|Reference=MA, 2005; SCBD, 2010; Scholes and Biggs, 2005; Faith et al., 2008; Musters et al., submitted; | |||
|InputVar=Management intensity crops; Management intensity livestock; Nitrogen deposition - grid; Global mean temperature; Protected area - grid; | |InputVar=Management intensity crops; Management intensity livestock; Nitrogen deposition - grid; Global mean temperature; Protected area - grid; | ||
|Parameter=Species-area relationships; Road-map - grid; Nitrogen critical load; Biome and eco-region - grid; MSA effect values; High resolution land cover (GLC2000) - grid; | |Parameter=Species-area relationships; Road-map - grid; Nitrogen critical load; Biome and eco-region - grid; MSA effect values; High resolution land cover (GLC2000) - grid; | ||
| Line 9: | Line 12: | ||
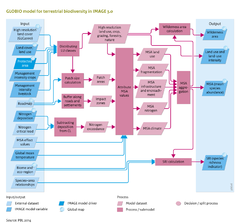
GLOBIO builds on a series of cause–effect relationships between environmental drivers and biodiversity, based on state-of-the-art knowledge. | GLOBIO builds on a series of cause–effect relationships between environmental drivers and biodiversity, based on state-of-the-art knowledge. | ||
The key measure of biodiversity in GLOBIO is the mean abundance of original species relative to their abundance in undisturbed ecosystems. Referred to as the mean species abundance (MSA), this measure reflects the degree to which the ecosystem is intact and is similar to the Biodiversity Intactness Index ([[Scholes and Biggs, 2005]]). New methods combine {{abbrTemplate|MSA}} estimates and species area relationships to estimate species loss at different geographical levels ([[Faith et al., 2008]]; [[Musters et al., submitted]]). The resulting Species Richness Index (SRI) is calculated as one of the end points of GLOBIO. The current version of SRI only covers vertebrate species. In addition, natural areas with high MSA values, defined as wilderness areas, are identified by their extent, landcover type and regional spread. The drivers of biodiversity loss considered are land-cover change, land-use intensity, fragmentation, climate change, atmospheric nitrogen deposition and infrastructural development. | The key measure of biodiversity in GLOBIO is the mean abundance of original species relative to their abundance in undisturbed ecosystems. Referred to as the mean species abundance (MSA), this measure reflects the degree to which the ecosystem is intact and is similar to the Biodiversity Intactness Index ([[Scholes and Biggs, 2005]]). New methods combine {{abbrTemplate|MSA}} estimates and species area relationships to estimate species loss at different geographical levels ([[Faith et al., 2008]]; [[Musters et al., submitted]]). The resulting Species Richness Index (SRI) is calculated as one of the end points of GLOBIO. The current version of SRI only covers vertebrate species. In addition, natural areas with high MSA values, defined as wilderness areas, are identified by their extent, landcover type and regional spread. The drivers of biodiversity loss considered are land-cover change, land-use intensity, fragmentation, climate change, atmospheric nitrogen deposition and infrastructural development. | ||
|ComponentCode=TB | |ComponentCode=TB | ||
|AggregatedComponent=Impacts | |AggregatedComponent=Impacts | ||
|FrameworkElementType=impact component | |FrameworkElementType=impact component | ||
}} | }} | ||
Revision as of 21:00, 17 May 2014
Parts of Terrestrial biodiversity
| Component is implemented in: |
|
| Projects/Applications |
| Key publications |
| References |
Key policy issues
- What is the future rate of terrestrial biodiversity loss in the absence of additional policies and measures?
- What are the key pressure factors causing biodiversity loss?
- How will nature conservation policies and measures to reduce the key pressure factors of biodiversity loss contribute to meeting the targets of the UN Convention on Biological Diversity (CBD)?