Aquatic biodiversity: Difference between revisions
Jump to navigation
Jump to search
No edit summary |
No edit summary |
||
| Line 1: | Line 1: | ||
{{ComponentTemplate2 | {{ComponentTemplate2 | ||
|KeyReference=Alkemade et al., 2011b; Janse et al., submitted; | |||
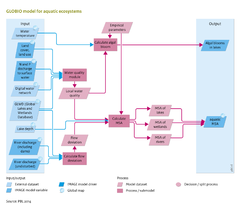
|InputVar=Land cover, land use - grid; N and P discharge to surface water - grid; River discharge - grid; | |InputVar=Land cover, land use - grid; N and P discharge to surface water - grid; River discharge - grid; | ||
|Parameter=GLWD (global lakes and wetlands database); Lake depth - grid; Digital water network - grid; GLWD (global lakes and wetlands database); Empirical MSA effect values; Water temperature - grid; | |Parameter=GLWD (global lakes and wetlands database); Lake depth - grid; Digital water network - grid; GLWD (global lakes and wetlands database); Empirical MSA effect values; Water temperature - grid; | ||
| Line 8: | Line 9: | ||
The biodiversity indicators are comparable with those in the GLOBIO model for terrestrial ecosystems: species richness and biodiversity intactness, which is the mean abundance of original species relative to their abundance in undisturbed ecosystems ({{abbrTemplate|MSA}}). Similar to its terrestrial counterpart, the driver-impact-relationships for aquatic biodiversity are based on meta-analyses of empirical data from the literature. In addition to biodiversity indicators, the model calculates the occurrence of harmful algal blooms in lakes. | The biodiversity indicators are comparable with those in the GLOBIO model for terrestrial ecosystems: species richness and biodiversity intactness, which is the mean abundance of original species relative to their abundance in undisturbed ecosystems ({{abbrTemplate|MSA}}). Similar to its terrestrial counterpart, the driver-impact-relationships for aquatic biodiversity are based on meta-analyses of empirical data from the literature. In addition to biodiversity indicators, the model calculates the occurrence of harmful algal blooms in lakes. | ||
|ComponentCode=AB | |ComponentCode=AB | ||
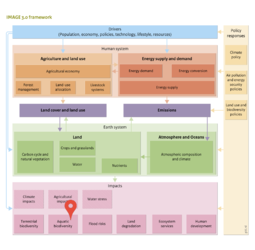
|AggregatedComponent=Impacts | |AggregatedComponent=Impacts | ||
|FrameworkElementType=impact component | |FrameworkElementType=impact component | ||
}} | }} | ||
Revision as of 09:28, 18 May 2014
Parts of Aquatic biodiversity
| Component is implemented in: |
|
| Projects/Applications |
| Models/Databases |
| Key publications |
| References |
Key policy issues
- How will the biodiversity in freshwater bodies develop in the absence of additional policies and measures?
- What are the key pressure factors causing loss of aquatic biodiversity?
- How will policies and measures to reduce the key pressure factors contribute to meeting the internationally agreed targets of the UN Convention on Biological Diversity (CBD)?