Ecosystem services/Description: Difference between revisions
Jump to navigation
Jump to search
m (RinekeOostenrijk moved page Ecosystem goods and services/Description to Ecosystem services/Description without leaving a redirect) |
No edit summary |
||
| Line 1: | Line 1: | ||
{{ComponentDescriptionTemplate | {{ComponentDescriptionTemplate | ||
|Reference=Maes et al., 2012; Egoh et al., 2008; Egoh et al., 2009; O'Farrell et al., 2010; Costanza et al., 1997; TEEB, 2010b; UNEP-WCMC, 2011; Burkhard et al., 2012; | |||
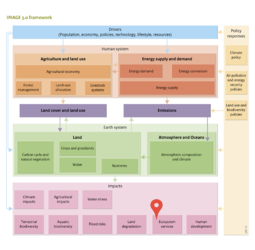
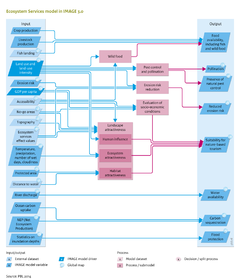
|Description=The supply of ecosystem services is quantified using other models in the IMAGE 3.0 framework, and where necessary combined with relationships between environmental variables and ecosystem services supply, derived from literature reviews (Figure Flowchart). | |||
Ecosystem services derived directly from other IMAGE models include the food provision from agricultural systems; water availability; carbon sequestration; and flood protection. Estimation of the services, wild food provision, erosion risk reduction, pollination, pest control and attractiveness for nature-based tourism, requires additional environmental variables and relationships ([[Maes et al., 2012]]; [[Schulp et al., 2012]]). A key variable for these services is fine-scale land use intensity data from the [[GLOBIO model]]. | |||
The supply of ecosystem services can be evaluated and aggregated in several ways. Some studies have constructed hotspot maps based on the number of services delivered ([[Egoh et al., 2008]]; [[Egoh et al., 2009]]; [[O'Farrell et al., 2010]]). Others translate service provision into monetary values for ecosystems ([[Costanza et al., 1997]]; [[TEEB, 2010b]]; [[UNEP-WCMC, 2011]]). | |||
The main shortcoming of hotspot maps and monetising is the lack of information whether sufficient ecosystem services are delivered to fulfil human requirements ([[Burkhard et al., 2012]]). Here, the service supply is compared to the potential requirement (minimum quantity required by humans) in order to assess surpluses and deficiencies. This translates into minimum quantities of food and water to stay healthy, or the minimum quantity of natural elements in a landscape to potentially pollinate all crops. The relation between supply and potential requirement is the ecosystem services budget. These budgets are relevant at different spatial scales, because some services can only be provided locally, while others (mainly goods) can be transported longer distances. The most relevant assessment scale for each ecosystem service was determined given the underlying modelling approaches (Table below). | |||
}} | }} | ||
Revision as of 06:56, 20 May 2014
Parts of Ecosystem services/Description