Policy intervention figure Land-use allocation: Difference between revisions
Jump to navigation
Jump to search
m (Text replace - "Agricultural systems" to "Land-use allocation") |
(CSV import) |
||
| Line 1: | Line 1: | ||
{{FigureTemplate | {{FigureTemplate | ||
|Figure=061g img13.png | |Figure=061g img13.png | ||
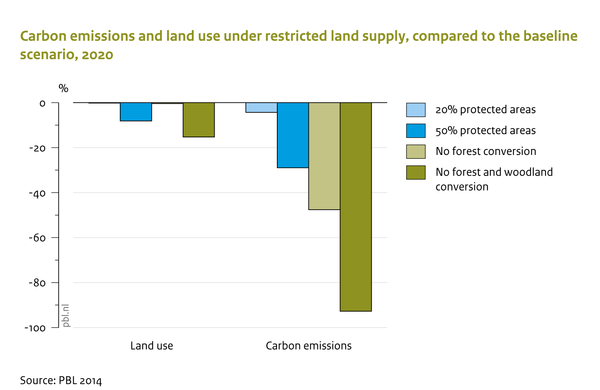
|AltText=Carbon emissions and land use compared to | |AltText=Carbon emissions and land use under restricted land supply, compared to the baseline scenario, 2020 | ||
|Caption= | |Caption=The effect of additional protected areas on land use and carbon emissions strongly depends on the type of vegetation protected. Preventing forest conversions will reduce carbon emissions, but not necessarily agricultural land use. | ||
|FigureType=Policy intervention figure | |FigureType=Policy intervention figure | ||
|OptimalSize=600 | |OptimalSize=600 | ||
|Component=Land-use allocation; | |Component=Land-use allocation; | ||
}} | }} | ||
Revision as of 14:43, 23 May 2014
Caption: The effect of additional protected areas on land use and carbon emissions strongly depends on the type of vegetation protected. Preventing forest conversions will reduce carbon emissions, but not necessarily agricultural land use.
Figure is used on page(s): Land-use allocation