Ecosystem services/Description: Difference between revisions
Jump to navigation
Jump to search
No edit summary |
No edit summary |
||
| Line 1: | Line 1: | ||
{{ComponentDescriptionTemplate | {{ComponentDescriptionTemplate | ||
|Reference=Maes et al., 2012; Egoh et al., 2008; Egoh et al., 2009; O'Farrell et al., 2010; Costanza et al., 1997; TEEB, 2010b; UNEP-WCMC, 2011; Burkhard et al., 2012;Nelson, 2008; EFI, 2007; Sea around us project, 2013; FAO, 2013b; Alcamo et al., 2003; Biemans et al., 2011; Vörösmarty et al., 2000; Crossman et al., 2013; Hootsmans et al., 2001; Gallai et al., 2009; Steffan-Dewenter and Tscharntke, 1999; Klein et al., 2011; Kleijn and Langevelde, 2006; Morandin et al., 2007; Schulp and Alkemade, 2011; Thies et al., 2003; Boccaccio and Petacchi, 2009; Rusch et al., 2011; Hawkins and Cornell, 1994; Bianchi et al., 2005; UNISDR, 2011; IPCC, 2012; Bell and Tobin, 2007; Van Asselen et al., 2013; Van Asselen et al., 2013; | |Reference=Maes et al., 2012; Egoh et al., 2008; Egoh et al., 2009; O'Farrell et al., 2010; Costanza et al., 1997; TEEB, 2010b; UNEP-WCMC, 2011; Burkhard et al., 2012;Nelson, 2008; EFI, 2007; Sea around us project, 2013; FAO, 2013b; Alcamo et al., 2003; Biemans et al., 2011; Vörösmarty et al., 2000; Crossman et al., 2013; Hootsmans et al., 2001; Gallai et al., 2009; Steffan-Dewenter and Tscharntke, 1999; Klein et al., 2011; Kleijn and Langevelde, 2006; Morandin et al., 2007; Schulp and Alkemade, 2011; Thies et al., 2003; Boccaccio and Petacchi, 2009; Rusch et al., 2011; Hawkins and Cornell, 1994; Bianchi et al., 2005; UNISDR, 2011; IPCC, 2012; Bell and Tobin, 2007; Van Asselen et al., 2013; Van Asselen et al., 2013; | ||
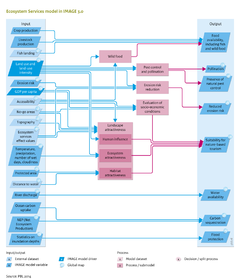
|Description=The supply of ecosystem services is quantified using other models in the IMAGE 3.0 framework, and where necessary combined with relationships between environmental variables and ecosystem services supply, derived from literature reviews (Figure Flowchart). | |Description=The supply of ecosystem services is quantified using other models in the IMAGE 3.0 framework, and where necessary combined with relationships between environmental variables and ecosystem services supply, derived from literature reviews (Figure Flowchart). | ||
| Line 59: | Line 59: | ||
</tr> | </tr> | ||
<tr> | <tr> | ||
<td valign="top">Provisioning services</td> | <td valign="top">Provisioning services | ||
<td>Cultural services</td> | </td> | ||
<td>0.5°x0.5° grid </td> | <td>Cultural services | ||
</tr> | </td> | ||
<td>0.5°x0.5° grid | |||
</td></tr> | |||
</table> | </table> | ||
Revision as of 19:32, 23 May 2014
Parts of Ecosystem services/Description