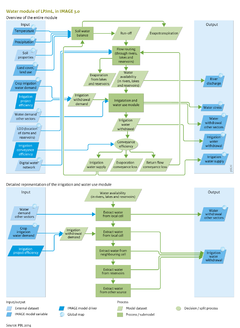
Water/Description: Difference between revisions
< Water
Jump to navigation
Jump to search
No edit summary |
Oostenrijr (talk | contribs) No edit summary |
||
| Line 38: | Line 38: | ||
===Impact indicators=== | ===Impact indicators=== | ||
{{DisplayFigureTemplate|Baseline figure | {{DisplayFigureTemplate|Baseline figure Water}} | ||
Water stress is often presented as a spatial and temporal average water withdrawal-to-availability ratio at basin or country level. The population living with water stress is estimated by overlaying such a water-stress (or water availability) map with a population density map. These indicators are used to present IMAGE-LPJmL results (for instance, in the [[OECD Environmental Outlook to 2050 (2012) project|OECD Environmental Outlook]], see Figure) but they mask the potential occurrence of water shortages in the short-term or on sub-basin scale. Thus, water stress should also be calculated at higher spatial and temporal resolutions, as can principally be done with LPJmL (see [[Biemans, 2012]]). | Water stress is often presented as a spatial and temporal average water withdrawal-to-availability ratio at basin or country level. The population living with water stress is estimated by overlaying such a water-stress (or water availability) map with a population density map. These indicators are used to present IMAGE-LPJmL results (for instance, in the [[OECD Environmental Outlook to 2050 (2012) project|OECD Environmental Outlook]], see Figure) but they mask the potential occurrence of water shortages in the short-term or on sub-basin scale. Thus, water stress should also be calculated at higher spatial and temporal resolutions, as can principally be done with LPJmL (see [[Biemans, 2012]]). | ||
The impacts of water stress differ per sector, but the indicators described above do not provide deeper insight into these impacts. In addition to the general water stress indicators, the model also considers production reduction in irrigated agriculture due to limited water availability as an indicator of agricultural water stress ([[Biemans, 2012]]). | The impacts of water stress differ per sector, but the indicators described above do not provide deeper insight into these impacts. In addition to the general water stress indicators, the model also considers production reduction in irrigated agriculture due to limited water availability as an indicator of agricultural water stress ([[Biemans, 2012]]). | ||
}} | }} | ||
Revision as of 13:43, 30 June 2014
Parts of Water/Description
| Component is implemented in: |
|
| Related IMAGE components |
| Projects/Applications |
| Key publications |
| References |
