Policy intervention figure Ecosystem services
Jump to navigation
Jump to search
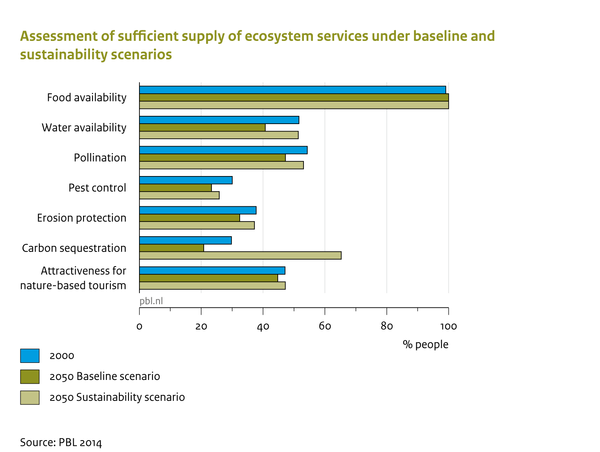
Caption: Assessment of sufficient supply of Ecosystem Services in the baseline as a map for the year 2000 (top), and aggregated to groups of services for 2000 and 2050 (bottom).
Figure is used on page(s): Ecosystem services