All baseline figures
All baseline figures from IMAGE framework
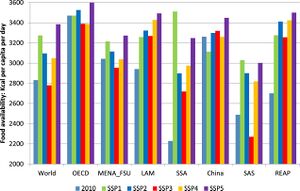
Food availability measured in kcal per capita per day available for consumption, for initial situation (2010) and for the SSP scenarios (2100), globally and by region. (van Meijl et al., 2020b)
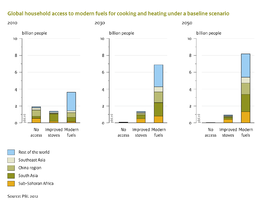
A few key indicators show the trends for energy security, access, air pollution under a baseline scenario.
In a baseline scenario, aquatic biodiversity is projected to decrease further.
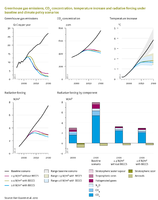
In the policy scenarios, emissions decrease strongly after 2020, while concentration levels only decrease or stabilise after 2050. Global mean temperature, due to inertia in the climate system, will not stabilise until the end of this century under the most ambitious climate policy scenario (2.6 W/m2).
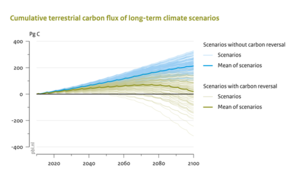
Cumulative terrestrial carbon flux of long-term climate scenarios (Müller et al., 2016)
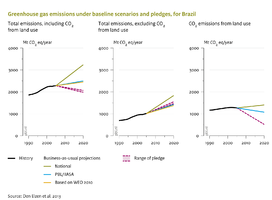
The national projection is from the National Decree No. 7390, and the WEO 2010 projection is from the World Energy Outlook (2010) of International Energy Agency.
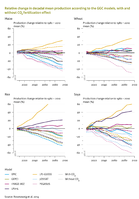
The effect of climate change on crop yields strongly depends on the effect of CO2 fertilisation, also represented in LPJmL. Lines show means across several climate scenarios; adopted from Rosenzweig et al. (2014).
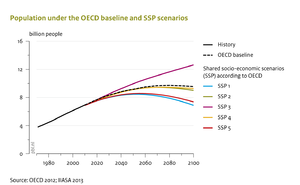
The total global population is projected to peak and then decline in the coming century, except under the high-end assumptions (SSP3). By 2100, the population may range between the current and twice as many as in 2000 in the SSPs. The OECD Outlook assumes an intermediate population growth trajectory, close to the medium population SSP scenarios.
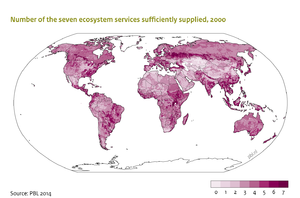
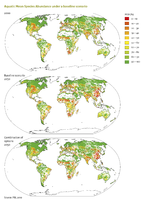
Assessing how many of the 7 ecosystem services addressed in IMAGE (food, water, Carbon sequestration, erosion protection, pollination, pest control, flood protection, tourism) can be sufficiently supplied allows to identify hotspots of losses in ecosystem services.
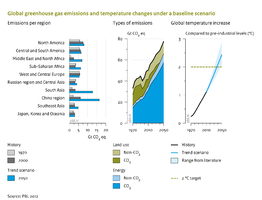
Future greenhouse gas emissions are mostly driven by an increase in energy use, while the relative contribution of land-use related emissions is projected to decrease.
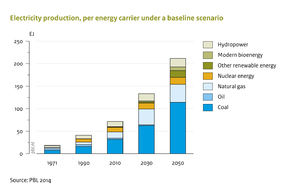
Increase in primary energy demand for electricity production is dominated by coal, despite a rapid growth of renewable energy.
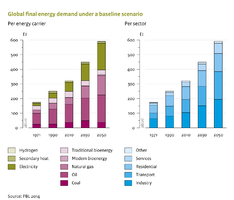
Between 2010 and 2050 energy demand for transport and industry, and for natural gas and electricity contribute most to the overall increase.
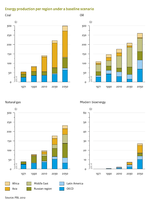
Over time the share of most important energy producers for different forms of energy changes. This has implications for energy security.
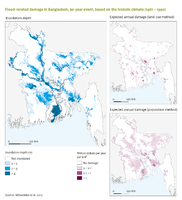
Inundation depth of 30-year flood scaled down to Bangladesh (left); The estimated annual damage due to floods (not only due to a 30-year event) is more concentrated when applying the land-use method compared to the population method.
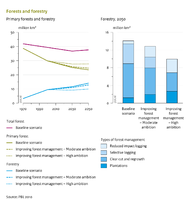
Areas of managed forest are projected to increase in the coming decades; improved forest management, especially forest plantations, could limit the area required for wood production.
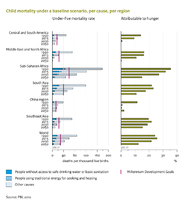
Under a baseline scenario, the global under-five mortality rates will only reach the level of the Millenium Development goals by 2050.
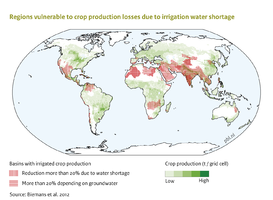
Regions vulnerable to crop production losses due to shortages in irrigation water (Biemans, 2012).
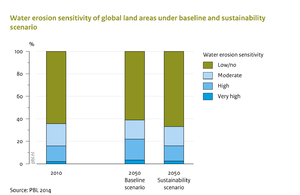
Under baseline conditions, the risk of high and very high water-induced erosion increases strongly up until 2050. Under the sustainability scenario (PBL, 2012), most of the increase under the baseline scenario is avoided by the combined effect of less land conversion and less climatic change.
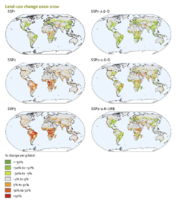
Natural land conversion in selected SSP scenarios for the 2020-2100 period (van Vuuren et al., 2021)
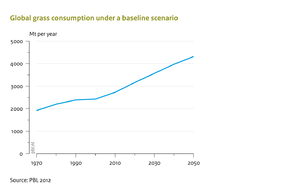
Despite a shift towards compound feed, global grass consumption in livestock systems is projected to increase (PBL, 2012).
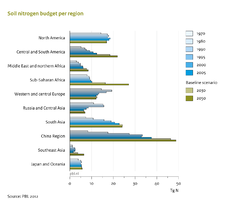
The nitrogen soil budgets in Northern America, Europe, Russia and Central Asia, Japan and Oceania are stable or decreasing after 2005, they are projected to strongly increase in many other regions in a baseline scenario.
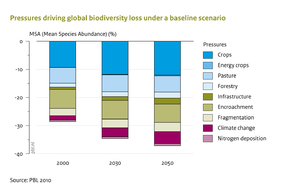
Land-use change and encroachment are projected to remain the most important drivers of biodiversity loss, but climate change will also become a significant pressure.
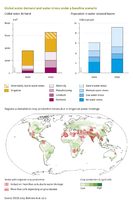
As a result of increasing water demand and climate change, the number of people living under water stress is projected to increase (top, OECD 2012), and more regions might face a reduction in crop production due to irrigation water shortage (bottom, Biemans 2012).
| Page | pagina | caption | alt |
|---|---|---|---|
| Baseline figure Agricultural economy |  | Food availability measured in kcal per capita per day available for consumption, for initial situation (2010) and for the SSP scenarios (2100), globally and by region. (van Meijl et al., 2020b) | Global agricultural production and areas per region |
| Baseline figure Air pollution and energy policies |  | A few key indicators show the trends for energy security, access, air pollution under a baseline scenario. | Global household access to modern fuels for cooking and heating under a baseline scenario |
| Baseline figure Aquatic biodiversity |  | In a baseline scenario, aquatic biodiversity is projected to decrease further. | Aquatic Mean Species Abundance under a baseline scenario |
| Baseline figure Atmospheric composition and climate |  | In the policy scenarios, emissions decrease strongly after 2020, while concentration levels only decrease or stabilise after 2050. Global mean temperature, due to inertia in the climate system, will not stabilise until the end of this century under the most ambitious climate policy scenario (2.6 W/m2). | Greenhouse gas emissions, CO2 concentration, temperature increase and radiative forcing under baseline and climate policy scenarios |
| Baseline figure Carbon cycle and natural vegetation |  | Cumulative terrestrial carbon flux of long-term climate scenarios (Müller et al., 2016) | Cumulative terrestrial carbon flux of long-term climate scenarios |
| Baseline figure Climate policy |  | The national projection is from the National Decree No. 7390, and the WEO 2010 projection is from the World Energy Outlook (2010) of International Energy Agency. | Greenhouse gas emissions under baseline scenarios and pledges, for Brazil |
| Baseline figure Crops and grass |  | The effect of climate change on crop yields strongly depends on the effect of CO2 fertilisation, also represented in LPJmL. Lines show means across several climate scenarios; adopted from Rosenzweig et al. (2014). | Relative change in decadal mean production according to the GGC models, with and without CO2 fertilization effect |
| Baseline figure Drivers |  | The total global population is projected to peak and then decline in the coming century, except under the high-end assumptions (SSP3). By 2100, the population may range between the current and twice as many as in 2000 in the SSPs. The OECD Outlook assumes an intermediate population growth trajectory, close to the medium population SSP scenarios. | Population under the OECD baseline and SSP scenarios |
| Baseline figure Ecosystem services |  | Assessing how many of the 7 ecosystem services addressed in IMAGE (food, water, Carbon sequestration, erosion protection, pollination, pest control, flood protection, tourism) can be sufficiently supplied allows to identify hotspots of losses in ecosystem services. | Numder of the seven ecosystem services sufficiently suppled, 2000 |
| Baseline figure Emissions |  | Future greenhouse gas emissions are mostly driven by an increase in energy use, while the relative contribution of land-use related emissions is projected to decrease. | Gloval greenhouse gas emissions and temperature changes under a baseline scenario |
| Baseline figure Energy conversion |  | Increase in primary energy demand for electricity production is dominated by coal, despite a rapid growth of renewable energy. | Electricity production, per energy carrier under a baseline scenario |
| Baseline figure Energy demand |  | Between 2010 and 2050 energy demand for transport and industry, and for natural gas and electricity contribute most to the overall increase. | Global final energy demand under a baseline scenario |
| Baseline figure Energy supply |  | Over time the share of most important energy producers for different forms of energy changes. This has implications for energy security. | Energy production per region under a baseline scenario |
| Baseline figure Flood risks |  | Inundation depth of 30-year flood scaled down to Bangladesh (left); The estimated annual damage due to floods (not only due to a 30-year event) is more concentrated when applying the land-use method compared to the population method. | Flood-related damage in Bangladesh, 30-year event, based on the historic climate (1961-1990) |
| Baseline figure Forest management |  | Areas of managed forest are projected to increase in the coming decades; improved forest management, especially forest plantations, could limit the area required for wood production. | Forest and forestry |
| Baseline figure Human development |  | Under a baseline scenario, the global under-five mortality rates will only reach the level of the Millenium Development goals by 2050. | Child mortality under a baseline scenario, per cause, per region |
| Baseline figure Water II |  | Regions vulnerable to crop production losses due to shortages in irrigation water (Biemans, 2012). | Regions vulnerable to crop production losses due to irrigation water shortage |
| Baseline figure Land degradation |  | Under baseline conditions, the risk of high and very high water-induced erosion increases strongly up until 2050. Under the sustainability scenario (PBL, 2012), most of the increase under the baseline scenario is avoided by the combined effect of less land conversion and less climatic change. | Water erosion sensitivity of global land areas under baseline and sustainability scenarios |
| Baseline figure Land-use allocation |  | Natural land conversion in selected SSP scenarios for the 2020-2100 period (van Vuuren et al., 2021) | Distribution of land systems |
| Baseline figure Livestock systems |  | Despite a shift towards compound feed, global grass consumption in livestock systems is projected to increase (PBL, 2012). | Global grass consumption under a baseline scenario |
| Baseline figure Nutrients |  | The nitrogen soil budgets in Northern America, Europe, Russia and Central Asia, Japan and Oceania are stable or decreasing after 2005, they are projected to strongly increase in many other regions in a baseline scenario. | Soil nitrogen budget per region |
| Baseline figure Terrestrial biodiversity |  | Land-use change and encroachment are projected to remain the most important drivers of biodiversity loss, but climate change will also become a significant pressure. | Pressures driving global biodiversity loss under a baseline scenario |
| Baseline figure Water |  | As a result of increasing water demand and climate change, the number of people living under water stress is projected to increase (top, OECD 2012), and more regions might face a reduction in crop production due to irrigation water shortage (bottom, Biemans 2012). | Global water demand and water stress under a baseline scenario |
Related overviews