All flow charts overview
All flowcharts from IMAGE framework
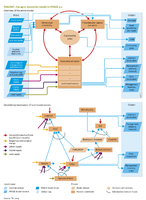
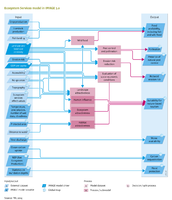
Flowchart Agricultural economy. See also the Input/Output Table on the introduction page.
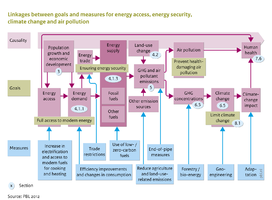
Flowchart Air pollution and energy policies. Linkages between components of the IMAGE system, energy policy objectives and possible policy measures.
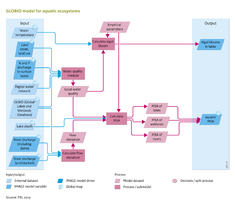
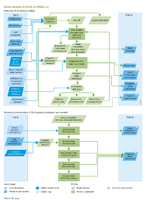
Flowchart Aquatic biodiversity. See also the Input/Output Table on the introduction page.
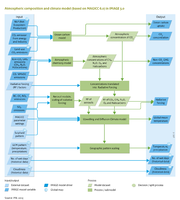
Flowchart Atmospheric composition and climate. See also the Input/Output Table on the introduction page.
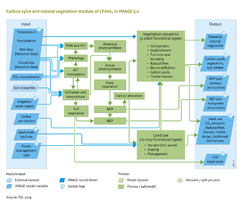
Flowchart Carbon cycle and natural vegetation. See also the Input/Output Table on the introduction page.
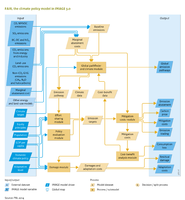
Flowchart Climate policy. See also the Input/Output Table on the introduction page.
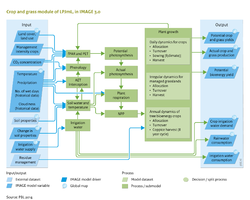
Flowchart Crops and grass. See also the Input/Output Table on the introduction page.
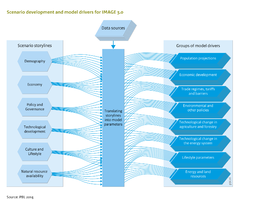
Flowchart Drivers. Model drives are inferred from scenario storylines taking into account external data sources, such as time series, cross-sector data, and literature sources.
Flowchart Ecosystem services. See also the Input/Output Table on the introduction page.
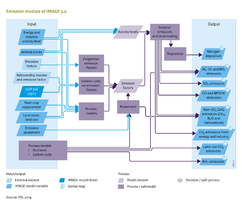
Flowchart Emissions. See also the Input/Output Table on the introduction page. Anthropogenic sources, for natural sources see Table 5.2.2. More detail on inputs and outputs, and how they link to other IMAGE components is presented at the end of this section (Emission table).
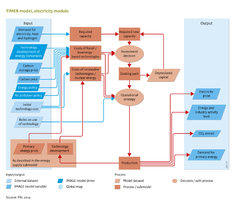
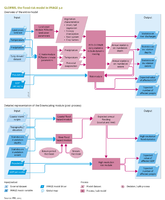
Flowchart Energy conversion. See also the Input/Output Table on the introduction page.
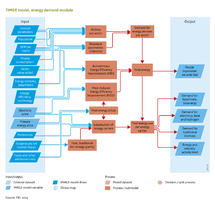
Some sectors are represented in a generic way as shown here, the sectors transport, residential and heavy industry are modelled in specific modules.
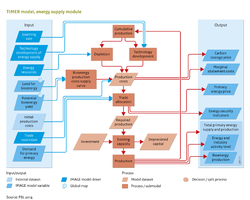
Flowchart Energy supply. See also the Input/Output Table on the introduction page.
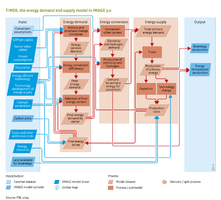
Flowchart Energy supply and demand. Overview of the IMAGE/TIMER model
Flowchart Flood risks. See also the Input/Output Table on the introduction page.
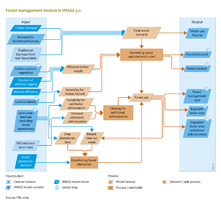
Flowchart Forest management. See also the Input/Output Table on the introduction page. The option of forest plantations in IMAGE and LPJmL is still under development, and expected to be available soon.
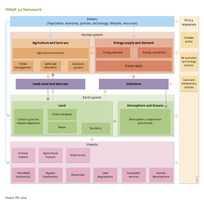
An overview of the IMAGE framework and its components
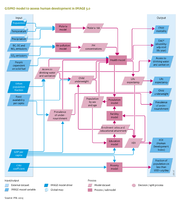
Flowchart Human development. See also the Input/Output Table on the introduction page.
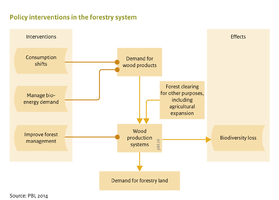
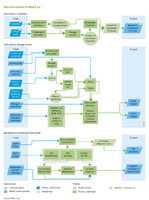
Flowchart Land and biodiversity policies (C). Policy interventions targeting the forestry sector.
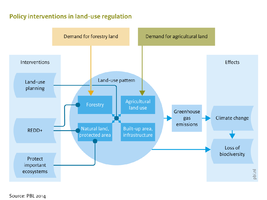
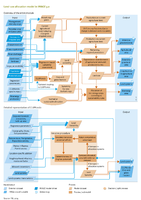
Flowchart Land and biodiversity policies (D). Policy interventions that regulate land use and land supply.
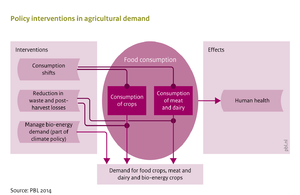
Flowchart Land and biodiversity policies (A). Policy interventions in the agricultural demand system.
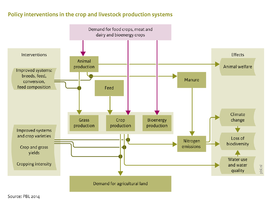
Flowchart Land and biodiversity policies (B). Policy interventions in crop and livestock production systems.
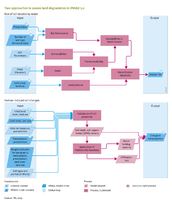
Flowchart Land degradation. See also the Input/Output Table on the introduction page.
Flowchart Land-use allocation. See also the Input/Output Table on the introduction page.
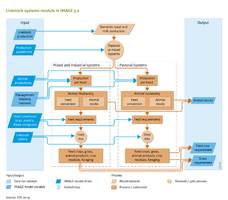
Flowchart Livestock systems. See also the Input/Output Table on the introduction page.
Flowchart Nutrients. See also the Input/Output Table on the introduction page.
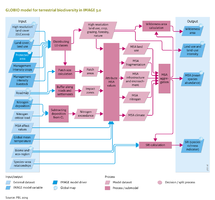
Flowchart Terrestrial biodiversity. See also the Input/Output Table on the introduction page.
Flowchart Water. See also the Input/Output Table on the introduction page.
| Page | pagina | caption | alt |
|---|---|---|---|
| Flowchart Agricultural economy |  | Flowchart Agricultural economy. See also the Input/Output Table on the introduction page. | MAGNET- the agro-economic model in IMAGE 3.0 |
| Flowchart Air pollution and energy policies |  | Flowchart Air pollution and energy policies. Linkages between components of the IMAGE system, energy policy objectives and possible policy measures. | Linkages between goals and measures for energy access, energy security, climate change and air pollution |
| Flowchart Aquatic biodiversity |  | Flowchart Aquatic biodiversity. See also the Input/Output Table on the introduction page. | GLOBIO model for aquatic ecosystems |
| Flowchart Atmospheric composition and climate |  | Flowchart Atmospheric composition and climate. See also the Input/Output Table on the introduction page. | Atmospheric composition and climate model (based on MAGICC 6.0) in IMAGE 3.0 |
| Flowchart Carbon cycle and natural vegetation |  | Flowchart Carbon cycle and natural vegetation. See also the Input/Output Table on the introduction page. | Carbon cycle and natural vegetation module of LPJmL, in IMAGE 3.0 |
| Flowchart Climate policy |  | Flowchart Climate policy. See also the Input/Output Table on the introduction page. | FAIR, the climate policy model in IMAGE 3.0 |
| Flowchart Crops and grass |  | Flowchart Crops and grass. See also the Input/Output Table on the introduction page. | Crop and grass module of LPJmL, in IMAGE 3.0 |
| Flowchart Drivers |  | Flowchart Drivers. Model drives are inferred from scenario storylines taking into account external data sources, such as time series, cross-sector data, and literature sources. | Scenario development and model drivers for IMAGE 3.0 |
| Flowchart Ecosystem services |  | Flowchart Ecosystem services. See also the Input/Output Table on the introduction page. | Ecosystem Services model in IMAGE 3.0 |
| Flowchart Emissions |  | Flowchart Emissions. See also the Input/Output Table on the introduction page. Anthropogenic sources, for natural sources see Table 5.2.2. More detail on inputs and outputs, and how they link to other IMAGE components is presented at the end of this section (Emission table). | Emission module of IMAGE 3.0 |
| Flowchart Energy conversion |  | Flowchart Energy conversion. See also the Input/Output Table on the introduction page. | TIMER model, electricity module |
| Flowchart Energy demand |  | Some sectors are represented in a generic way as shown here, the sectors transport, residential and heavy industry are modelled in specific modules. | TIMER model, energy demand module |
| Flowchart Energy supply |  | Flowchart Energy supply. See also the Input/Output Table on the introduction page. | TIMER model, energy supply module |
| Flowchart Energy supply and demand |  | Flowchart Energy supply and demand. Overview of the IMAGE/TIMER model | TIMER, the energy demand and supply model in IMAGE 3.0 |
| Flowchart Flood risks |  | Flowchart Flood risks. See also the Input/Output Table on the introduction page. | GLOFRIS, the flood risk model in IMAGE 3.0 |
| Flowchart Forest management |  | Flowchart Forest management. See also the Input/Output Table on the introduction page. The option of forest plantations in IMAGE and LPJmL is still under development, and expected to be available soon. | Forest management module in IMAGE 3.0 |
| IMAGE framework schematic |  | An overview of the IMAGE framework and its components | An overview of the IMAGE framework |
| Flowchart Human development |  | Flowchart Human development. See also the Input/Output Table on the introduction page. | GISMO model to assess human development in IMAGE 3.0 |
| Flowchart Land and biodiversity policies (C) |  | Flowchart Land and biodiversity policies (C). Policy interventions targeting the forestry sector. | Policy interventions in the forestry system |
| Flowchart Land and biodiversity policies (D) |  | Flowchart Land and biodiversity policies (D). Policy interventions that regulate land use and land supply. | Policy interventions in land-use regulation |
| Flowchart Land and biodiversity policies (A) |  | Flowchart Land and biodiversity policies (A). Policy interventions in the agricultural demand system. | Policy interventions in agricultural demand |
| Flowchart Land and biodiversity policies (B) |  | Flowchart Land and biodiversity policies (B). Policy interventions in crop and livestock production systems. | Policy interventions in the crop and livestock production systems |
| Flowchart Land degradation |  | Flowchart Land degradation. See also the Input/Output Table on the introduction page. | Two approaches to assess land degradation in IMAGE 3.0 |
| Flowchart Land-use allocation |  | Flowchart Land-use allocation. See also the Input/Output Table on the introduction page. | Land-use allocation model in IMAGE 3.0 |
| Flowchart Livestock systems |  | Flowchart Livestock systems. See also the Input/Output Table on the introduction page. | Livestock systems module in IMAGE 3.0 |
| Flowchart Nutrients |  | Flowchart Nutrients. See also the Input/Output Table on the introduction page. | Nutrient module of IMAGE 3.0 |
| Flowchart Terrestrial biodiversity |  | Flowchart Terrestrial biodiversity. See also the Input/Output Table on the introduction page. | GLOBIO model for terrestrial biodiversity in IMAGE 3.0 |
| Flowchart Water |  | Flowchart Water. See also the Input/Output Table on the introduction page. | Water module of LPJmL, in IMAGE 3.0 |
Related overviews