All policy intervention figures
All Policy intervention figures from IMAGE framework
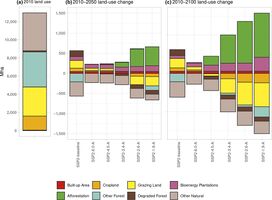
(a) Land use in 2010. Land-use change in (b) 2010–2050 and (c) 2010–2100 for the scenarios with afforestation (Doelman et al., 2020)
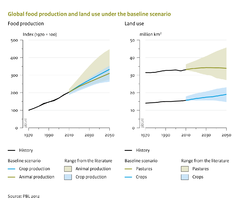
Changes in agricultural production and land use
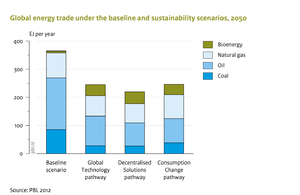
Compared to the baseline, energy trade is significantly reduced under the sustainability scenarios (PBL, 2012).
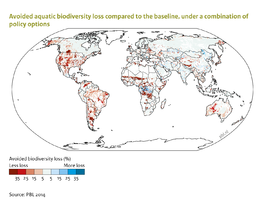
A set of ambitious policy options could reduce aquatic biodiversity loss compared to a baseline scenario.
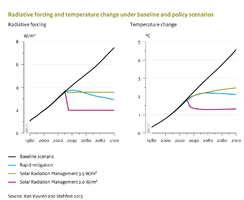
In addition to ‘conventional’ climate policy, there may be situations where urgent action on climate change is required, either via rapid mitigation, or via Solar Radiation Management (SRM) (e.g. sulphur emissions to the stratosphere). Radiative forcing is immediately stabilised at the intended level by SRM, and also temperatures are adjusted immediately (though not yet at the equilibrium level), and even faster under extreme SRM than would be possible through strong mitigation. However, substantial uncertainties and risks are related to such drastic manipulations of the radiation balance.
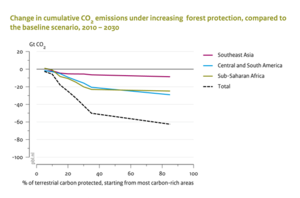
Increasingly strict REDD regimes might lead to substantial reduction in cumulative terrestrial CO2 emission (Overmars et al., 2014).
002g ind16
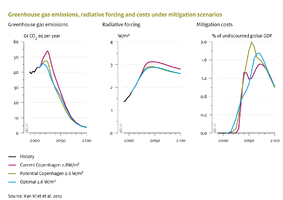
Scenario results describing emission pathways representing optimal and delayed policy action (Copenhagen pledges) in 2020, in terms of CO2 emission (including land use), associated radiative forcing (including all gases and aerosol forcing), and global mitigation costs (as percentage of GDP).
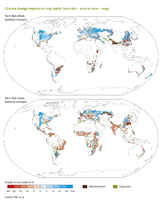
By the end of the century climate change impacts on crop yields under the baseline could be reduced by stringent climate policy.
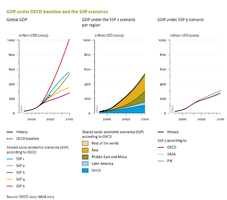
Projected total world GDP in the OECD environmental outlook (OECD, 2012) and in the SSP scenarios according to OECD (left), per world region in SSP2 according to OECD (middle) and according to different sources for SSP3 (right). GDP (Gross Domestic Product) is shown in purchasing power parity (ppp), SSP data from the SSP database (IIASA, 2013).
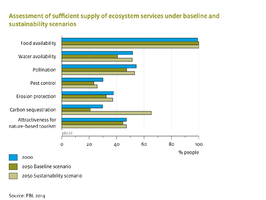
While the supply of ecosystem services is decreasing under a baseline scenario, much of this decline could be avoided under a sustainability scenario (all based on PBL, 2012).
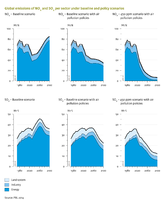
Climate policy has important co-benefits for air pollution.
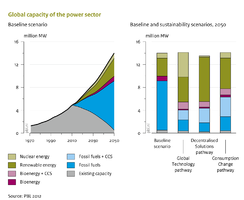
The large share of conventional coal power in the baseline is replaced by fossil power with CCS and renewable capacity in the sustainability scenarios.
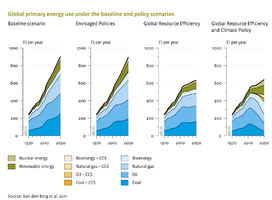
The ‘envisaged policies’ scenario includes currently planned policies, the ‘global resource efficiency’ scenario assumes ambitious energy efficiency policies, and the ‘global resource efficiency and climate policy’ scenario additionally assumes policies to meet the 2 °C target. Total primary energy use could be significantly reduced by policies on energy efficiency, whereas additional climate policy would mostly affect the type of resources used. (Van den Berg et al., 2011b)
043x img13
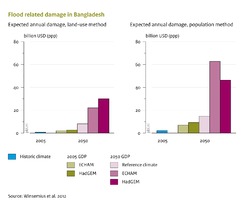
Future expected annual damage due to flooding depends on future climate change, but much even more on future GDP and population distribution.
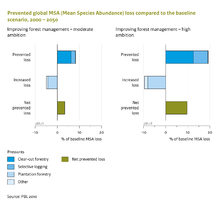
Improved forest management can contribute to reducing biodiversity loss (measured in MSA, see Component Terrestrial biodiversity ).
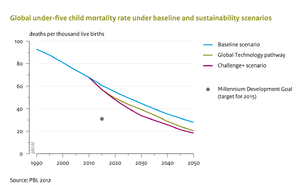
Compared to the baseline, the sustainability scenarios ‘Global Technology’ and ‘Challenge +’ (PBL, 2012) will reduce child mortality, but the MDG target set for 2015 would still only be met after 2030.
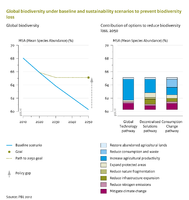
Biodiversity is projected to decline further in the baseline scenario (left). Various measures in the demand system, the production system and in land-use regulation contribute to reducing biodiversity loss in the sustainability scenarios (right).
Results of several interventions in declining biodiversity loss (PBL, 2010)
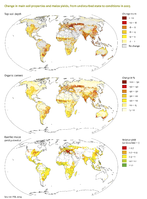
As a result of soil degradation and changes in soil properties, yields are up to 30 % lower than they would have been under pristine conditions, in some parts of the world.
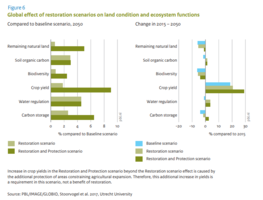
Impact of land-use change, protection and restoration policies on ecosystem functions (van Esch et al., 2021)
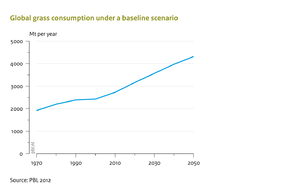
Future trends in grassland areas strongly depend on grassland management and productivity (PBL, 2012).
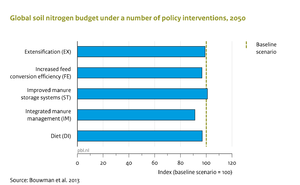
Several policy interventions can lead to a reduction in the global soil nitrogen budget compared to a baseline scenario (Bouwman et al., 2013c).
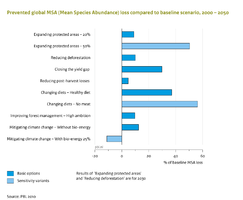
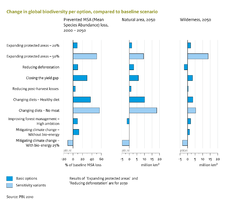
Several policy interventions in land-use regulation, production and demand systems could prevent some of the biodiversity loss projected in the baseline. The single largest effects can be expected from closing the yield gap, and from dietary changes.
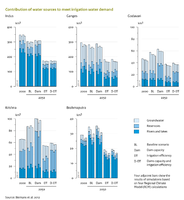
Three of the five water basins on the Indian subcontinent strongly rely on groundwater resources to meet irrigation water demand. Doubling the capacity of large dams can increase the amount of irrigation water available in some basins. In all basins, improved irrigation efficiency leads to a significant reduction in water required for irrigation.
| Page | pagina | caption | alt |
|---|---|---|---|
| Policy intervention figure Agricultural economy |  | (a) Land use in 2010. Land-use change in (b) 2010–2050 and (c) 2010–2100 for the scenarios with afforestation (Doelman et al., 2020) | |
| Policy intervention figure Land cover and land use |  | Changes in agricultural production and land use | Global food production and land use under the baseline scenario |
| Policy intervention figure Air pollution and energy policies |  | Compared to the baseline, energy trade is significantly reduced under the sustainability scenarios (PBL, 2012). | Global energy trade under the baseline and sustainability scenarios, 2050 |
| Policy intervention figure Aquatic biodiversity |  | A set of ambitious policy options could reduce aquatic biodiversity loss compared to a baseline scenario. | Avoided aquatic biodiversity loss compared to the baseline, under a combination of policy options |
| Policy intervention figure Atmospheric composition and climate |  | In addition to ‘conventional’ climate policy, there may be situations where urgent action on climate change is required, either via rapid mitigation, or via Solar Radiation Management (SRM) (e.g. sulphur emissions to the stratosphere). Radiative forcing is immediately stabilised at the intended level by SRM, and also temperatures are adjusted immediately (though not yet at the equilibrium level), and even faster under extreme SRM than would be possible through strong mitigation. However, substantial uncertainties and risks are related to such drastic manipulations of the radiation balance. | Radiative forcing and temperature change under baseline and policy scenarios |
| Policy intervention figure Carbon cycle and natural vegetation II |  | Increasingly strict REDD regimes might lead to substantial reduction in cumulative terrestrial CO2 emission (Overmars et al., 2014). | Change in cumulative CO2 emissions under increasing forest protection, compared to the baseline scenario, 2010-2030 |
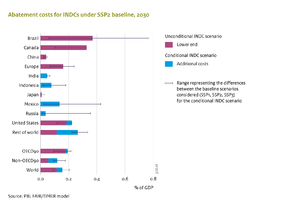
| 002g ind16 CP |  | Regional and global abatement costs for NDCs | |
| Policy intervention figure Climate policy |  | Scenario results describing emission pathways representing optimal and delayed policy action (Copenhagen pledges) in 2020, in terms of CO2 emission (including land use), associated radiative forcing (including all gases and aerosol forcing), and global mitigation costs (as percentage of GDP). | Greenhouse gas emissions, radiative forcing and costs under mitigation scenarios |
| Policy intervention figure Crops and grass |  | By the end of the century climate change impacts on crop yields under the baseline could be reduced by stringent climate policy. | Climate change impacts on crop yields from 1981 - 2010 to 2070 - 2099 |
| Policy intervention figure Drivers |  | Projected total world GDP in the OECD environmental outlook (OECD, 2012) and in the SSP scenarios according to OECD (left), per world region in SSP2 according to OECD (middle) and according to different sources for SSP3 (right). GDP (Gross Domestic Product) is shown in purchasing power parity (ppp), SSP data from the SSP database (IIASA, 2013). | GDP under OECD baseline and the SSP scenarios |
| Policy intervention figure Ecosystem services |  | While the supply of ecosystem services is decreasing under a baseline scenario, much of this decline could be avoided under a sustainability scenario (all based on PBL, 2012). | Assessment of sufficient supply of ecosystem services under the baseline and sustainability scenarios |
| Policy intervention figure Emissions |  | Climate policy has important co-benefits for air pollution. | Global emission of NOx and SO2 per sector under baseline and policy scenarios |
| Policy intervention figure Energy conversion |  | The large share of conventional coal power in the baseline is replaced by fossil power with CCS and renewable capacity in the sustainability scenarios. | Global capacity of the power sector |
| Policy intervention figure Energy demand |  | The ‘envisaged policies’ scenario includes currently planned policies, the ‘global resource efficiency’ scenario assumes ambitious energy efficiency policies, and the ‘global resource efficiency and climate policy’ scenario additionally assumes policies to meet the 2 °C target. Total primary energy use could be significantly reduced by policies on energy efficiency, whereas additional climate policy would mostly affect the type of resources used. (Van den Berg et al., 2011b) | Global primary energy use under baseline and policy scenarios |
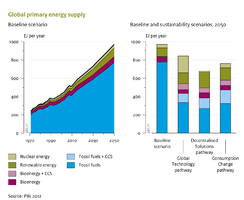
| Policy intervention figure Energy supply |  | Global primary energy supply | |
| Policy intervention figure Flood risks |  | Future expected annual damage due to flooding depends on future climate change, but much even more on future GDP and population distribution. | Flood related damage in Bangladesh |
| Policy intervention figure Forest management |  | Improved forest management can contribute to reducing biodiversity loss (measured in MSA, see Component Terrestrial biodiversity ). | Prevented global MSA (Mean Species Abundance) loss compared to the baseline scenario, 2000 - 2050 |
| Policy intervention figure Human development |  | Compared to the baseline, the sustainability scenarios ‘Global Technology’ and ‘Challenge +’ (PBL, 2012) will reduce child mortality, but the MDG target set for 2015 would still only be met after 2030. | Global under-five mortality rate under baseline and sustainability scenarios |
| Policy intervention figure Land and biodiversity policies II |  | Biodiversity is projected to decline further in the baseline scenario (left). Various measures in the demand system, the production system and in land-use regulation contribute to reducing biodiversity loss in the sustainability scenarios (right). | Global biodiversity under baseline and sustainability scenarios to prevent biodiversity loss |
| Policy intervention figure Land and biodiversity policies |  | Results of several interventions in declining biodiversity loss (PBL, 2010) | Change in global biodiversity per option, compared to baseline scenario |
| Policy intervention figure Land degradation |  | As a result of soil degradation and changes in soil properties, yields are up to 30 % lower than they would have been under pristine conditions, in some parts of the world. | Changein main soil properties and maize yields, from undisturbed state to conditions in 2005 |
| Policy intervention figure Land-use allocation |  | Impact of land-use change, protection and restoration policies on ecosystem functions (van Esch et al., 2021) | Carbon emissions and land use under restricted land supply, compared to the baseline scenario, 2020 |
| Policy intervention figure Livestock systems |  | Future trends in grassland areas strongly depend on grassland management and productivity (PBL, 2012). | Global grassland area under baseline and sustainability scenario |
| Policy intervention figure Nutrients |  | Several policy interventions can lead to a reduction in the global soil nitrogen budget compared to a baseline scenario (Bouwman et al., 2013c). | Global soil nitrogen budget under a number of policy interventions, 2050 |
| Policy intervention figure Terrestrial biodiversity |  | Several policy interventions in land-use regulation, production and demand systems could prevent some of the biodiversity loss projected in the baseline. The single largest effects can be expected from closing the yield gap, and from dietary changes. | Prevented global MSA (Mean Species Abundance) loss compared to baseline scenario, 2000 - 2050 |
| Policy intervention figure Water |  | Three of the five water basins on the Indian subcontinent strongly rely on groundwater resources to meet irrigation water demand. Doubling the capacity of large dams can increase the amount of irrigation water available in some basins. In all basins, improved irrigation efficiency leads to a significant reduction in water required for irrigation. | Contribution of water sources to meet irrigation water demand |
Related overviews