Aquatic biodiversity/Description: Difference between revisions
Jump to navigation
Jump to search
Oostenrijr (talk | contribs) No edit summary |
Oostenrijr (talk | contribs) No edit summary |
||
| Line 1: | Line 1: | ||
{{ComponentDescriptionTemplate | {{ComponentDescriptionTemplate | ||
|Reference=Weijters et al., 2009; Harper, 1992; Bouwman et al., 2013c; Lehner and Döll, 2004; Kourzeneva, 2010; Ladson and White, 1999; Biemans et al., 2011; Kuiper et al., | |Reference=Weijters et al., 2009; Harper, 1992; Bouwman et al., 2013c; Lehner and Döll, 2004; Kourzeneva, 2010; Ladson and White, 1999; Biemans et al., 2011; Kuiper et al., 2014; | ||
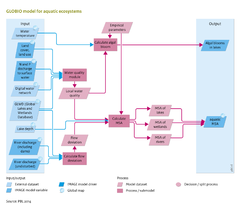
|Description=GLOBIO aquatic assesses biodiversity intactness,expressed as mean species abundance (MSA) in inland aquatic ecosystems: rivers and streams, deep and shallow lakes and wetlands such as floodplain wetlands, marshes, and isolated wetlands. See Figure Flowchart. | |Description=GLOBIO aquatic assesses biodiversity intactness,expressed as mean species abundance (MSA) in inland aquatic ecosystems: rivers and streams, deep and shallow lakes and wetlands such as floodplain wetlands, marshes, and isolated wetlands. See Figure Flowchart. | ||
| Line 11: | Line 11: | ||
The river network and GLWD map were combined in an overall water network map to estimate nutrient loadings to water bodies. Some wetland types are assumed to be isolated from the river network and thus only influenced by the land-use and nutrient emissions in the specific grid cell. An adapted wetland map can be used to take account of historical or projected wetland conversions to other land-use ([[Van Asselen et al., 2013]]). | The river network and GLWD map were combined in an overall water network map to estimate nutrient loadings to water bodies. Some wetland types are assumed to be isolated from the river network and thus only influenced by the land-use and nutrient emissions in the specific grid cell. An adapted wetland map can be used to take account of historical or projected wetland conversions to other land-use ([[Van Asselen et al., 2013]]). | ||
For rivers and riverine wetlands, GLOBIO also considers the effect of hydrological changes on biodiversity. Monthly river discharges in pristine and in present or future situations (affected by climate change, dams and water abstraction) are derived from the hydrology module in LPJ model ((Component [[Nutrients]]). These monthly discharge patterns are used to calculate the deviation between affected and natural seasonal pattern, referred to as the Amended Annual Proportional Flow Deviation ([[Ladson and White, 1999]]; [[Biemans et al., 2011]]). Literature data on biodiversity in rivers under different regulation (e.g., by dams) were combined and expressed as a change in MSA ([[Janse et al., submitted]]). A comparable analysis was performed on the effects of flow deviation of biodiversity in riverine wetlands ([[Kuiper et al., | For rivers and riverine wetlands, GLOBIO also considers the effect of hydrological changes on biodiversity. Monthly river discharges in pristine and in present or future situations (affected by climate change, dams and water abstraction) are derived from the hydrology module in LPJ model ((Component [[Nutrients]]). These monthly discharge patterns are used to calculate the deviation between affected and natural seasonal pattern, referred to as the Amended Annual Proportional Flow Deviation ([[Ladson and White, 1999]]; [[Biemans et al., 2011]]). Literature data on biodiversity in rivers under different regulation (e.g., by dams) were combined and expressed as a change in MSA ([[Janse et al., submitted]]). A comparable analysis was performed on the effects of flow deviation of biodiversity in riverine wetlands ([[Kuiper et al., 2014]]). | ||
The MSA value for each water body (river, lake, wetland) is calculated by multiplying the values for the relevant drivers. The final indicator, aquatic MSA, is calculated by area-weighted averaging of MSA values for rivers, lakes and wetlands. In addition to MSA, the probability of dominance of harmful algal blooms of cyanobacteria in lakes is calculated as a biodiversity indicator, based on P concentration, N:P ratio, and water temperature ([[Håkanson et al., 2007]]. The results are expressed as the proportion of lakes with a cyanobacteria biomass above the WHO standard. | The MSA value for each water body (river, lake, wetland) is calculated by multiplying the values for the relevant drivers. The final indicator, aquatic MSA, is calculated by area-weighted averaging of MSA values for rivers, lakes and wetlands. In addition to MSA, the probability of dominance of harmful algal blooms of cyanobacteria in lakes is calculated as a biodiversity indicator, based on P concentration, N:P ratio, and water temperature ([[Håkanson et al., 2007]]. The results are expressed as the proportion of lakes with a cyanobacteria biomass above the WHO standard. | ||
Revision as of 16:22, 10 August 2015
Parts of Aquatic biodiversity/Description
| Component is implemented in: |
|
| Projects/Applications |
| Models/Databases |
| Key publications |
| References |