Baseline figure Agricultural economy: Difference between revisions
Jump to navigation
Jump to search

m (Text replace - "Agricultural economy and forestry" to "Agricultural economy") |
(CSV import) |
||
| Line 2: | Line 2: | ||
|Figure=047x img13.png | |Figure=047x img13.png | ||
|AltText=Global agricultural production and areas per region | |AltText=Global agricultural production and areas per region | ||
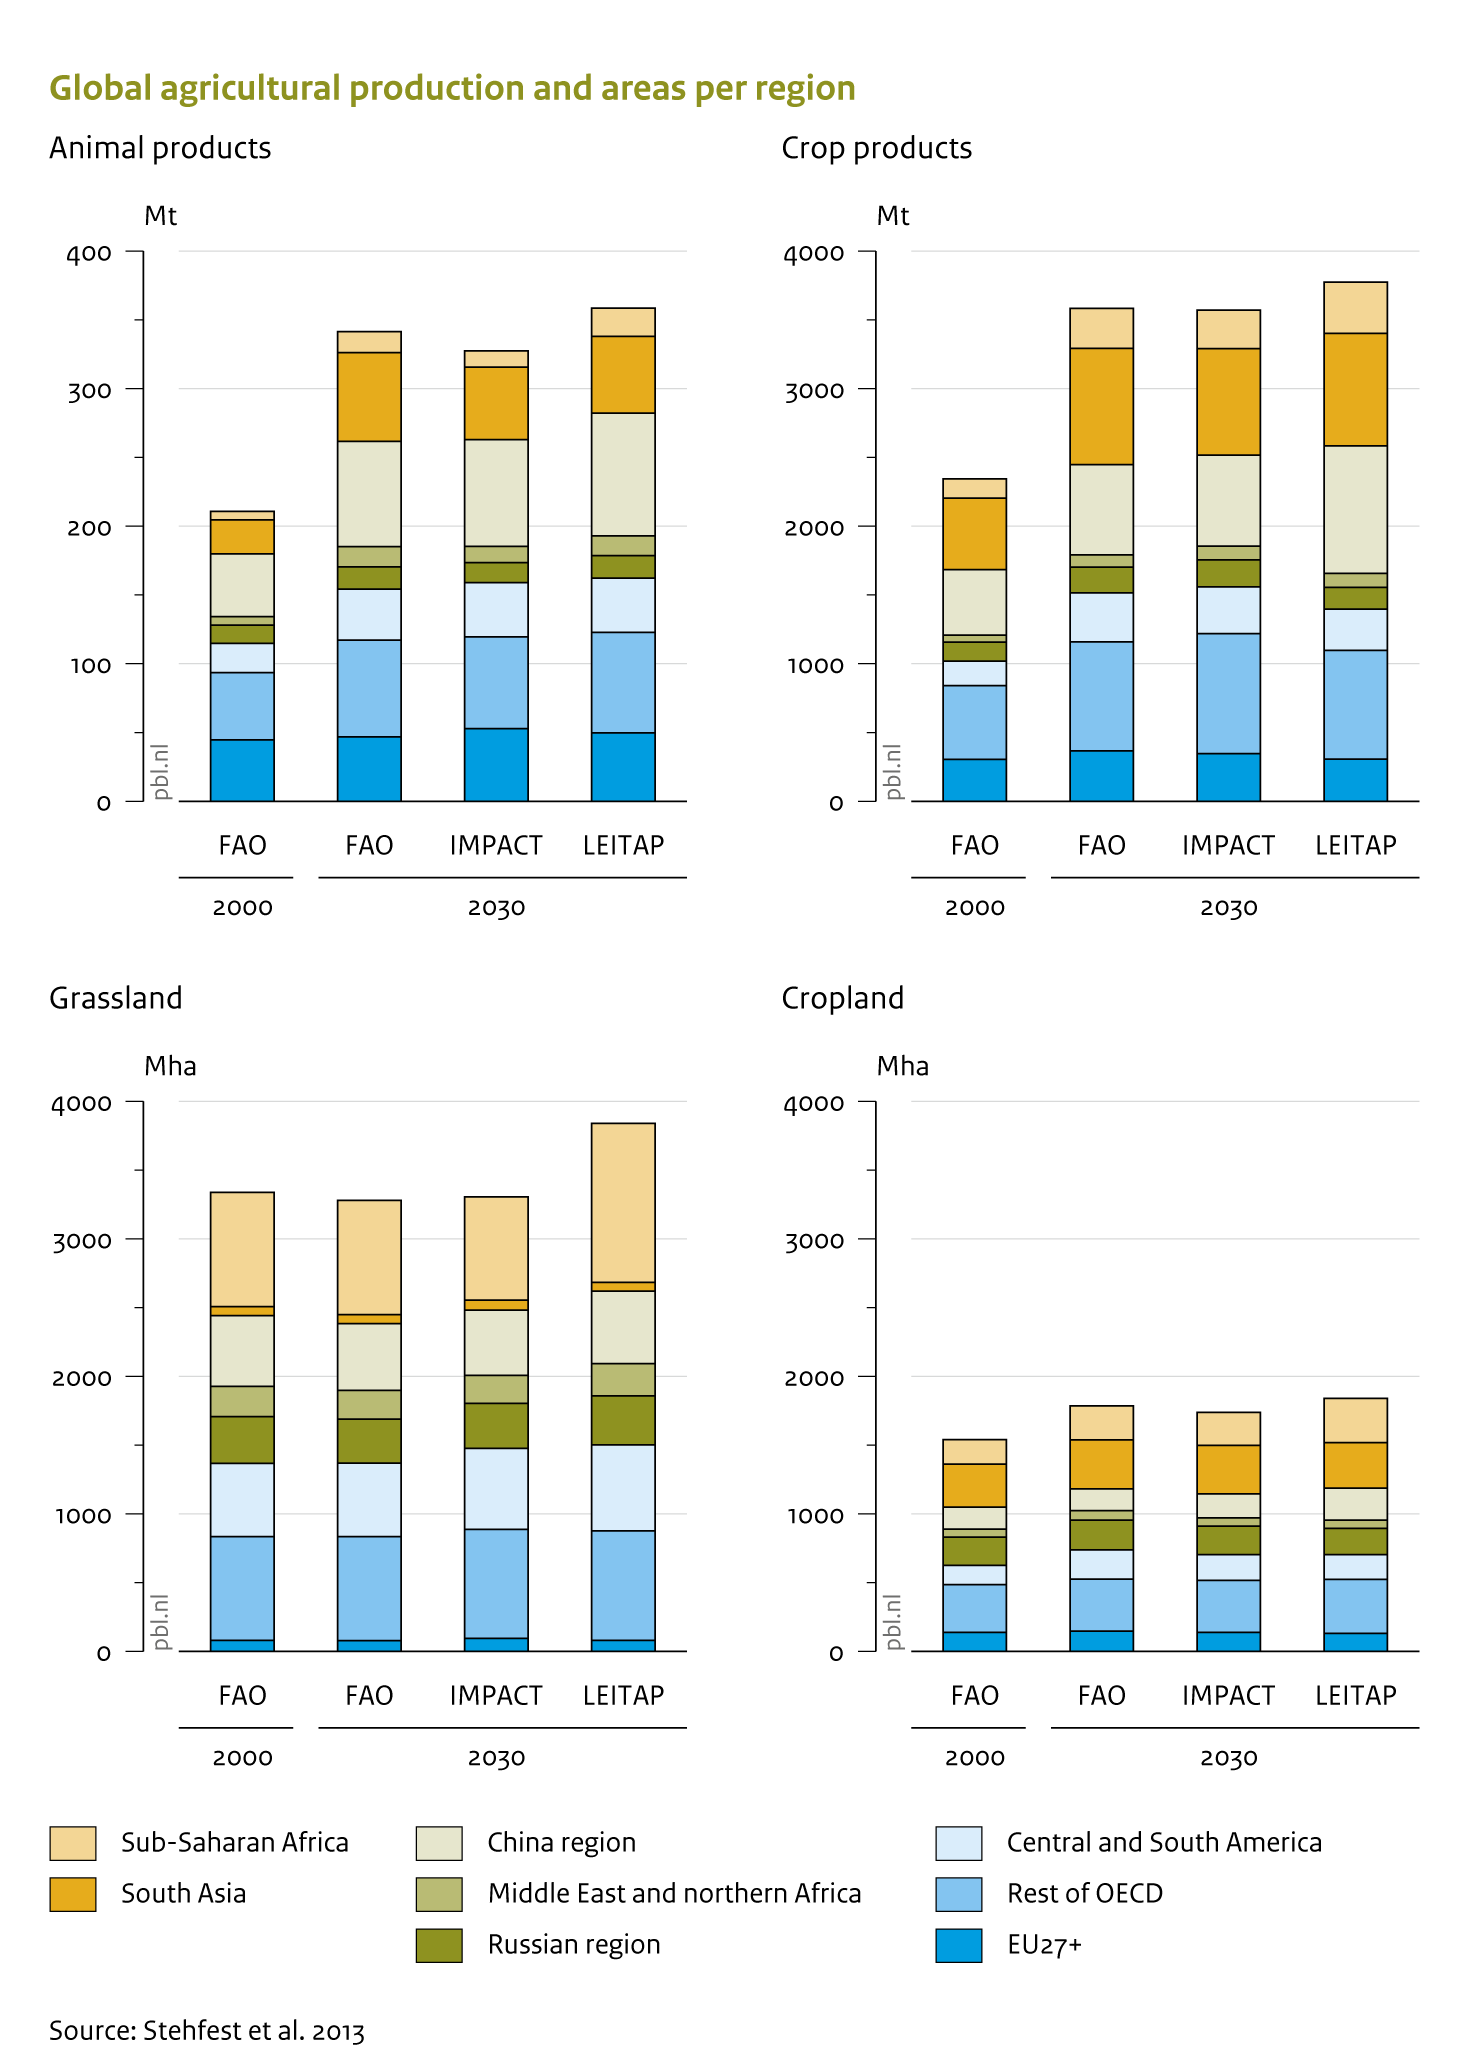
|Caption= | |Caption=Agricultural production increases strongly between 2000 and 2030, according to an implementation of FAO projections (Bruinsma, 2003) in IMAGE, and according to IMPACT and MAGNET (formerly LEITAP) projections (Stehfest et al., 2013). Changes in agricultural areas differ across models. | ||
|FigureType=Baseline figure | |FigureType=Baseline figure | ||
|OptimalSize=500 | |OptimalSize=500 | ||
|Component=Agricultural economy; | |Component=Agricultural economy; | ||
}} | }} | ||
Revision as of 14:43, 23 May 2014
Caption: Agricultural production increases strongly between 2000 and 2030, according to an implementation of FAO projections (Bruinsma, 2003) in IMAGE, and according to IMPACT and MAGNET (formerly LEITAP) projections (Stehfest et al., 2013). Changes in agricultural areas differ across models.
Figure is used on page(s): Agricultural economy