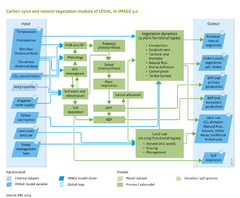
Carbon cycle and natural vegetation/Policy issues: Difference between revisions
Jump to navigation
Jump to search
Oostenrijr (talk | contribs) No edit summary |
Oostenrijr (talk | contribs) m (Text replacement - "Müller et al., in revision" to "Müller et al., 2016b") |
||
| Line 3: | Line 3: | ||
|Description=Several economic developments and policy interventions are related to the dynamics of the terrestrial carbon budget. The terrestrial and marine carbon budgets determine the overall reduction in greenhouse gas emissions and aerosols needed to limit CO<sub>2</sub> build-up in the atmosphere. If the current terrestrial sink diminishes or becomes a carbon source, additional emission reductions will be required. Furthermore, protecting natural ecosystems or using alternative forest management options may contribute to storing and retaining more carbon in the biosphere (see also [[Strengers et al., 2008]]; [[Van Minnen et al., 2008]]). These options can be evaluated with the linked IMAGE-LPJmL model for baseline scenarios and policy interventions. | |Description=Several economic developments and policy interventions are related to the dynamics of the terrestrial carbon budget. The terrestrial and marine carbon budgets determine the overall reduction in greenhouse gas emissions and aerosols needed to limit CO<sub>2</sub> build-up in the atmosphere. If the current terrestrial sink diminishes or becomes a carbon source, additional emission reductions will be required. Furthermore, protecting natural ecosystems or using alternative forest management options may contribute to storing and retaining more carbon in the biosphere (see also [[Strengers et al., 2008]]; [[Van Minnen et al., 2008]]). These options can be evaluated with the linked IMAGE-LPJmL model for baseline scenarios and policy interventions. | ||
For instance, the IMAGE-LPJmL model has been used to assess key uncertainties about the terrestrial carbon balance (the figure below). The study conducted by Müller et al. ([[Müller et al., | For instance, the IMAGE-LPJmL model has been used to assess key uncertainties about the terrestrial carbon balance (the figure below). The study conducted by Müller et al. ([[Müller et al., 2016b|in revision]]) included multiple values for climate sensitivity, including multiple climate patterns, for two different socio-economic scenarios. These experiments showed a possible shift in the terrestrial biosphere from sink to source under a broad range of changes in mean global temperature (2.3-6.8 °C up until 2100), and atmospheric CO<sub>2</sub> concentrations (475–936 ppm). The rate of temperature increase was identified as the decisive threshold determining the shift, with values from 0.04 to 0.08 °C/y, depending on the {{abbrTemplate|GCM}} pattern. The LPJmL model calculations suggest that the likelihood of a carbon balance shift in the 21st century increases almost linearly from ~5% to ~90% when climate sensitivity is increased from 2.5°C to 5.0 °C. | ||
|Example=The model can also be used to study the impact of a range of policy measures, e.g. aimed at increasing the carbon storage of natural vegetation. Policy measures to increase carbon storage often generate co-benefits, such as restoration of watershed and wildlife habitats, and prevention of soil erosion. However, a critical issue is the permanency of additional carbon storage. | |Example=The model can also be used to study the impact of a range of policy measures, e.g. aimed at increasing the carbon storage of natural vegetation. Policy measures to increase carbon storage often generate co-benefits, such as restoration of watershed and wildlife habitats, and prevention of soil erosion. However, a critical issue is the permanency of additional carbon storage. | ||
For instance, a policy intervention would be the use of forestry measures allowed under the Kyoto Protocol. The protocol provides opportunities for developed countries to partly achieve their emission reduction targets by planting new forests or by managing established forests and agricultural land to store more carbon in the soil ({{abbrTemplate|ARD}}), and to reduce emissions resulting from deforestation and degradation ({{abbrTemplate|REDD}}). Recently, IMAGE was used to estimate the emission reductions and costs related to REDD schemes ([[Overmars et al., accepted]]). Forest carbon stocks are protected expansion at increasingly high levels, and not available for agricultural use in [[MAGNET model|MAGENET]] and IMAGE. As a result, agriculture expands less, and CO<sub>2</sub> emissions are reduced by up to 100 Gt CO<sub>2</sub> compared to baseline levels, with most of the reduction potential in Latin America and Africa (the figure below). | For instance, a policy intervention would be the use of forestry measures allowed under the Kyoto Protocol. The protocol provides opportunities for developed countries to partly achieve their emission reduction targets by planting new forests or by managing established forests and agricultural land to store more carbon in the soil ({{abbrTemplate|ARD}}), and to reduce emissions resulting from deforestation and degradation ({{abbrTemplate|REDD}}). Recently, IMAGE was used to estimate the emission reductions and costs related to REDD schemes ([[Overmars et al., accepted]]). Forest carbon stocks are protected expansion at increasingly high levels, and not available for agricultural use in [[MAGNET model|MAGENET]] and IMAGE. As a result, agriculture expands less, and CO<sub>2</sub> emissions are reduced by up to 100 Gt CO<sub>2</sub> compared to baseline levels, with most of the reduction potential in Latin America and Africa (the figure below). | ||
}} | }} | ||
Revision as of 11:37, 23 June 2017
Parts of Carbon cycle and natural vegetation/Policy issues
| Component is implemented in: |
|
| Related IMAGE components |
| Models/Databases |
| Key publications |
| References |
