Policy intervention figure Air pollution and energy policies: Difference between revisions
Jump to navigation
Jump to search
No edit summary |
(CSV import) |
||
| Line 1: | Line 1: | ||
{{FigureTemplate | {{FigureTemplate | ||
|Figure=132g img13.png | |Figure=132g img13.png | ||
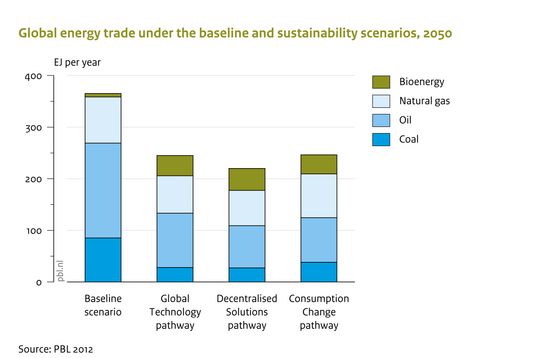
|AltText=Global energy trade | |AltText=Global energy trade under the baseline and sustainability scenarios, 2050 | ||
|Caption= | |Caption=Compared to the baseline, energy trade is significantly reduced under the sustainability scenarios (PBL, 2012). | ||
|FigureType=Policy intervention figure | |FigureType=Policy intervention figure | ||
|OptimalSize=550 | |OptimalSize=550 | ||
|Component=Air pollution and energy policies; | |Component=Air pollution and energy policies; | ||
}} | }} | ||
Revision as of 14:43, 23 May 2014
Caption: Compared to the baseline, energy trade is significantly reduced under the sustainability scenarios (PBL, 2012).
Figure is used on page(s): Air pollution and energy policies, Air pollution and energy policies/Policy issues
View Image "550" is not in the list (0, 240, 300, 400, 500, 600, 800) of allowed values for the "HasOptimalSize" property.