Policy intervention figure Land-use allocation: Difference between revisions
Jump to navigation
Jump to search
Oostenrijr (talk | contribs) m (Oostenrijr moved page Policy intervention figureLand-use allocation to Policy intervention figure Land-use allocation without leaving a redirect) |
Dafnomilii (talk | contribs) No edit summary |
||
| Line 1: | Line 1: | ||
{{FigureTemplate | {{FigureTemplate | ||
|Figure= | |Figure=Capture2.PNG | ||
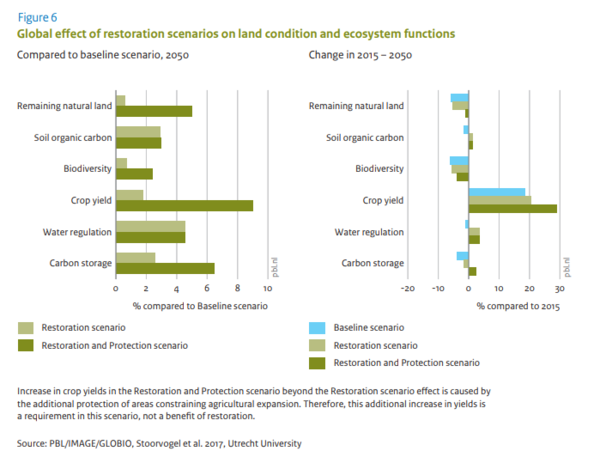
|AltText=Carbon emissions and land use under restricted land supply, compared to the baseline scenario, 2020 | |AltText=Carbon emissions and land use under restricted land supply, compared to the baseline scenario, 2020 | ||
|Caption= | |Caption=Impact of land-use change, protection and restoration policies on ecosystem functions (van Esch et al., 2021) | ||
|FigureType=Policy intervention figure | |FigureType=Policy intervention figure | ||
|OptimalSize=600 | |OptimalSize=600 | ||
|Component=Land-use allocation | |Component=Land-use allocation | ||
}} | }} | ||
Latest revision as of 17:48, 31 October 2021
Caption: Impact of land-use change, protection and restoration policies on ecosystem functions (van Esch et al., 2021)
Figure is used on page(s): Land-use allocation