Terrestrial biodiversity: Difference between revisions
Jump to navigation
Jump to search
No edit summary |
m (Text replace - "Biomes, ecoregions" to "Biomes and ecoregions - grid") |
||
| Line 1: | Line 1: | ||
{{ComponentTemplate2 | {{ComponentTemplate2 | ||
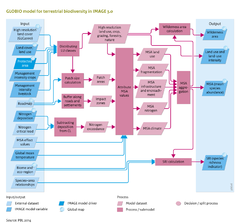
|InputVar=Land cover (GLC2000); Protected area - grid; Management intensity crops; Management intensity livestock; Nitrogen deposition - grid; Global mean temperature; Infrastructure; Critical load; Biomes | |InputVar=Land cover (GLC2000); Protected area - grid; Management intensity crops; Management intensity livestock; Nitrogen deposition - grid; Global mean temperature; Infrastructure; Critical load; Biomes and ecoregions - grid; | ||
|OutputVar=Mean Species Abundance; Species Richness Index; Wilderness area; | |OutputVar=Mean Species Abundance; Species Richness Index; Wilderness area; | ||
|Parameter=Species lists for ecoregions; | |Parameter=Species lists for ecoregions; | ||
Revision as of 13:30, 5 February 2014
Parts of Terrestrial biodiversity
| Component is implemented in: |
|
| Projects/Applications |
| Key publications |
| References |
Key policy issues
- What is the future rate of terrestrial biodiversity loss in the absence of additional policies and measures?
- What are the key pressure factors causing biodiversity loss?
- How will nature conservation policies and measures to reduce the key pressure factors of biodiversity loss contribute to meeting the targets of the UN Convention on Biological Diversity (CBD)?