Land degradation/Description: Difference between revisions
Jump to navigation
Jump to search
No edit summary |
Oostenrijr (talk | contribs) No edit summary |
||
| Line 1: | Line 1: | ||
{{ComponentDescriptionTemplate | {{ComponentDescriptionTemplate | ||
|Reference=Oldeman et al., 1991; Batjes, 1997; Harris et al., 2013; Batjes, 2009; FAO et al., 2009; | |Reference=Oldeman et al., 1991; Batjes, 1997; Harris et al., 2013; Batjes, 2009; FAO et al., 2009; | ||
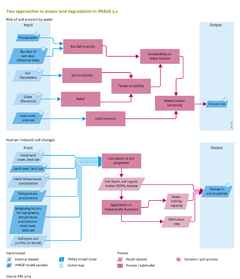
|Description=Water erosion is the main cause of land degradation (1049 million hectares (Mha), followed by wind erosion (548 Mha), chemical degradation (239 Mha) and physical degradation (83 Mha) (GLASOD; [[Oldeman et al., 1991|Oldeman et al. (1991)]]). IMAGE assesses soil erosion by water ([[Hootsmans et al., 2001]]) by calculating a water erosion sensitivity index, ranging from zero (no erosion risk) to one (extremely high erosion risk). This risk is calculated for each grid cell as the compounded result from the following indices: | |Description=Water erosion is the main cause of land degradation (1049 million hectares (Mha), followed by wind erosion (548 Mha), chemical degradation (239 Mha) and physical degradation (83 Mha) (GLASOD; [[Oldeman et al., 1991|Oldeman et al. (1991)]]). IMAGE assesses soil erosion by water ([[Hootsmans et al., 2001]]) by calculating a water erosion sensitivity index, ranging from zero (no erosion risk) to one (extremely high erosion risk). This risk is calculated for each grid cell as the compounded result from the following indices: | ||
==A. Risk of soil erosion caused by water== | ==A. Risk of soil erosion caused by water== | ||
| Line 30: | Line 30: | ||
Management systems are in use around the world to reduce the risk of erosion, such as building terraces, zero tillage, planting or conserving protective vegetation zones around fields, and high capacity drainage systems. The Water Erosion Sensitivity Index cannot capture all these and other interventions for the current situation, let alone into the future. The index only indicates areas potentially under threat. Impacts on crop production and soil quality cannot be derived directly from the indicator. | Management systems are in use around the world to reduce the risk of erosion, such as building terraces, zero tillage, planting or conserving protective vegetation zones around fields, and high capacity drainage systems. The Water Erosion Sensitivity Index cannot capture all these and other interventions for the current situation, let alone into the future. The index only indicates areas potentially under threat. Impacts on crop production and soil quality cannot be derived directly from the indicator. | ||
Comparison of the calculation above and the GLASOD degradation status maps by [[Oldeman et al., 1991|Oldeman et al. (1991)]] shows maximum correspondence with use of the classification in | Comparison of the calculation above and the GLASOD degradation status maps by [[Oldeman et al., 1991|Oldeman et al. (1991)]] shows maximum correspondence with use of the classification in the table below. This classification can be used as a guide in analysing the water erosion sensitivity indicator. | ||
<div class="thumbcaption dark">Classification of the Water Erosion Sensitivity Index</div> | <div class="thumbcaption dark">Classification of the Water Erosion Sensitivity Index</div> | ||
Revision as of 14:36, 24 June 2014
Parts of Land degradation/Description
| Component is implemented in: |
|
| Related IMAGE components |
| Projects/Applications |
| Models/Databases |
| Key publications |
| References |