Terrestrial biodiversity/Description: Difference between revisions
Jump to navigation
Jump to search
No edit summary |
No edit summary |
||
| Line 1: | Line 1: | ||
{{ComponentDescriptionTemplate | {{ComponentDescriptionTemplate | ||
|Reference=Bartholome et al., 2004; UNEP-WCMC, 2005; Dixon et al., 2001; Visconti et al., 2011; Alkemade et al., 2012; Alkemade et al., 2011a; Bouwman et al., 2002b; Bobbink et al., 2010; DMA, 1992; Meijer and Klein Goldewijk, 2009; Benitez-Lopez et al., 2010; UNEP, 2001; Verboom et al., submitted; Faith et al., 2008; Musters et al., submitted; | |||
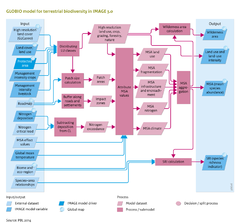
|Description=The GLOBIO model calculates changes in biodiversity in terrestrial ecosystems, based on seven drivers of biodiversity change: land-use change, land-use intensity, climate change, atmospheric nitrogen deposition, infrastructural development, encroachment and fragmentation. | |Description=The GLOBIO model calculates changes in biodiversity in terrestrial ecosystems, based on seven drivers of biodiversity change: land-use change, land-use intensity, climate change, atmospheric nitrogen deposition, infrastructural development, encroachment and fragmentation. | ||
Four steps in the model are distinguished: | Four steps in the model are distinguished: | ||
| Line 46: | Line 47: | ||
===Aggregation=== | ===Aggregation=== | ||
Total MSA values per area unit are calculated by multiplying the individual MSA values related to the separate drivers of biodiversity change (Figure Flowchart) to arrive at the total effect of all drivers. The contribution of individual drivers to biodiversity loss is also calculated. | Total MSA values per area unit are calculated by multiplying the individual MSA values related to the separate drivers of biodiversity change (Figure Flowchart) to arrive at the total effect of all drivers. The contribution of individual drivers to biodiversity loss is also calculated. | ||
Wilderness areas are defined as natural areas with high (>0.8) MSA values. The Species Richness Index (SRI) is calculated by applying species–area relationships according to Faith et al. ([[Faith et al., 2008|2008]]), and using MSA values as a proxy for their intactness parameter. Aggregation from regional to global species richness is based on species lists in the Wildfinder database to avoid double counting ([[Musters et al., submitted]]). | Wilderness areas are defined as natural areas with high (>0.8) MSA values. The Species Richness Index (SRI) is calculated by applying species–area relationships according to Faith et al. ([[Faith et al., 2008|2008]]), and using MSA values as a proxy for their intactness parameter. Aggregation from regional to global species richness is based on species lists in the Wildfinder database to avoid double counting ([[Musters et al., submitted]]). | ||
}} | }} | ||
Revision as of 21:29, 17 May 2014
Parts of Terrestrial biodiversity/Description
| Component is implemented in: |
|
| Projects/Applications |
| Key publications |
| References |
|