Terrestrial biodiversity/Description
Parts of Terrestrial biodiversity/Description
| Component is implemented in: |
|
| Projects/Applications |
| Key publications |
| References |
|
Model description of Terrestrial biodiversity
).
Deposition rates of atmospheric nitrogen for current and future years are derived from IMAGE (Components {{Emissions]] and Nutrients), and the map of critical loads is based on Bouwman et al. (2002b). The nitrogen exceedance is calculated by subtracting the critical load from the estimated deposition. For forested and grassland ecosystems, the MSA map for nitrogen is derived from the regression equation between nitrogen exceedance and the proportion of remaining species. Regression equations are derived from published impact studies on the effects of a nitrogen surplus on species composition (Bobbink et al., 2010).
Infrastructure and Encroachment
The construction and use of infrastructure, such as roads, railroads and built-up area, may have multiple impacts on biodiversity. Roads have a direct impact on species, for example as the result of traffic disturbance, road kills and habitat fragmentation (see below). There are also indirect impacts, such as increased human access to natural areas, increasing hunting, gathering and tourism. Traffic disturbance reduces the breeding success of bird and mammal species, reducing their abundance close to infrastructure. Hunting and gathering reduce populations when intensity exceeds threshold values.
Data on infrastructure are derived from globally available road maps, such as the Digital Chart of the World (DMA, 1992) and the GRIP, Global Roads Inventory Project (Meijer and Klein Goldewijk, 2009). Direct impacts occur in a 500 m zone on both sides of roads and an MSA value is derived from a meta-analysis on disturbance effects (Benitez-Lopez et al., 2010).
Human settlements are the major access points to natural areas, and are likely to correlate with agricultural areas. Thus, 20 km impact zones are calculated around cropland areas and assigned as encroachment areas. Based on literature review of hunting activities, an MSA value of 0.7 is attributed to such zones. The MSA map for infrastructure and encroachment is obtained by combining the MSA map for direct (infrastructure) and indirect (encroachment) effects. In projections, the impact zone of direct effects is broadened according to the GLOBIO2.0 procedure (UNEP, 2001). Future impact zones for indirect effects are determined by the projections for agricultural areas.
Ecosystem fragmentation
Conversion of natural land to intensive cropping and road construction change vast areas of contiguous wilderness into a fragmented landscape with remnants of natural areas remaining as isolated islands. These relatively small patches are likely to house fewer species than could be expected from their habitat quality, because the individual patches may be too small to sustain viable populations of some species. Based on literature data on minimum area requirements of species, a relationship is constructed between patch size and relative number of species compared to a non-fragmented situation, known as the minimum area requirement (MAR) curve (Verboom et al., submitted). The relative number of species in a certain patch according to this MAR curve is used as a proxy for mean species abundance (MSA).
The area of natural vegetation patches is calculated by reclassifying the GLC2000 Global Land Cover data into two classes: human-dominated land (including croplands and urban areas) and natural land. Contiguous cells of natural land are grouped together and with an overlay of main roads (see above) are used to produce a map of natural land patches.
In scenario projections, patch sizes change as agricultural land use expands and as new roads emerge (Verboom et al., submitted). Changes in patch sizes also change the relative number of species and the MSA biodiversity indicator.
Aggregation
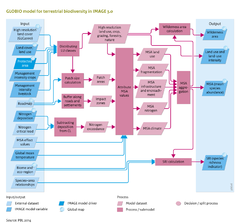
Total MSA values per area unit are calculated by multiplying the individual MSA values related to the separate drivers of biodiversity change (Figure Flowchart) to arrive at the total effect of all drivers. The contribution of individual drivers to biodiversity loss is also calculated. Wilderness areas are defined as natural areas with high (>0.8) MSA values. The Species Richness Index (SRI) is calculated by applying species–area relationships according to Faith et al. (2008), and using MSA values as a proxy for their intactness parameter. Aggregation from regional to global species richness is based on species lists in the Wildfinder database to avoid double counting (Musters et al., submitted).
}}