Download
Downloadable items:
- USS: the User Support system (USS) to view IMAGE scenario results (see below).
- Big flowchart: a printable pdf of the big flowchart of IMAGE framework, containing all data flows from-to the model components.
User Support System IMAGE scenarios
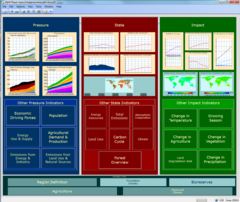
The User Support System (USS) is a visualisation tool that enables a comprehensive view on the scenario data of IMAGE runs. See the figures on the right ( click to enlarge). The tool also enables you to obtain the data. You can download this tool which covers a number of projects. The USS manual page offers a user guide on the USS.
IMAGE 3.0 Results
Download viewer USS_IMAGE3.0 direct or via the Download packages page
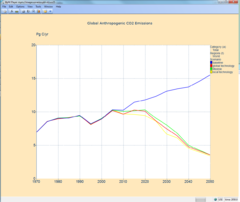
The first IMAGE 3.0 results are the SSP scenarios of the Shared Socioeconomic Pathways - SSP project. The USS_IMAGE3.0 shows data for the SSP2 scenarios:
- the baseline SSP2
and the following SSP2 mitigation scenarios:
- SSP2_SPA0_RCP_1.9
- SSP2_SPA2_RCP_2.6
- SSP2_SPA2_RCP_3.4
- SSP2_SPA2_RCP_4.5
- SSP2_SPA2_RCP_6.0
SPA2 indicates fragmented & delayed policy, SPA0 indicates global uniform policy without delay.
Spatial data for these scenarios are available in netcdf format from KNMI data center
Additional scenario data for SSP1, SSP3, SSP4 and SSP5 are available on request. Please contact the IMAGE team at IMAGE-info@pbl.nl
Available projects
You can download the viewer packages from this page: Download packages
There are currently three packages available:
- USS_IMAGE3.0: viewer for SSP2 scenarios:
- see project info on Shared Socioeconomic Pathways - SSP project
- USS_IMAGE2.4-2.5: viewer for scenario results of projects:
- see project info: OECD Environmental Outlook to 2050 (2012);
- see project info: Roads from Rio+20 (2012)and
- see project info: EU Resource efficiency (2011).
- USS_IMAGE2.2: viewer for scenario results of projects:
- see project info: Millennium Ecosystem Assessment - MA (2005) and
- see project info: IPCC SRES (2000);
Obtain data
How to download regional data - graph
Hover your cursor over the border area of a box/container or graph. Right mouse click and select the option:
- Save selection as Excel...: A data set will be created containing the data related to the lines in the graph (your item selection of the dimensions of the active data set). You can save the (xml) file onto your system.
- Save container as Excel...: A data set will be created containing all data of the selected graph or of all the graphs in the selected box/container with the exception of the map data (see below).
Open the xml file with Excel.
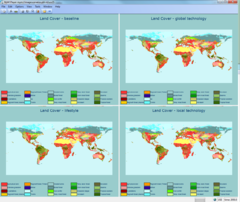
How to download spatial data - map
IMAGE 3.0 data: Spatial data of SSP scenarios are available via the KNMI Data Center: KDC
Previous IMAGE versions: Hover your cursor over the border area of the map. Right mouse click and select the option:
- Save...: You can save map data onto your system. All available years will be included in the data set. However, this data set only contains values for the IMAGE land cells. In order to use the data in GIS software, you will need to convert the data set in ascii-grid format.
The zip-file contains a utility folder that includes the m2gis program. Double click on the m2gis.exe and a form will guide you through the conversion.