Water: Difference between revisions
Jump to navigation
Jump to search
m (Text replace - "Scenario drivers" to "Drivers") |
m (Text replace - "Natural vegetation and carbon cycle" to "Carbon cycle and natural vegetation") |
||
| Line 1: | Line 1: | ||
{{ComponentTemplate2 | {{ComponentTemplate2 | ||
|Application=OECD Environmental Outlook to 2050 (2012) project; | |Application=OECD Environmental Outlook to 2050 (2012) project; | ||
|IMAGEComponent=Drivers; Agriculture and land use; | |IMAGEComponent=Drivers; Agriculture and land use; Carbon cycle and natural vegetation; Crop and grass; Forest management; Human development; Energy supply and demand; | ||
|KeyReference=Rost et al., 2008; Gerten et al., 2004; Biemans et al., 2011; Biemans, 2012; | |KeyReference=Rost et al., 2008; Gerten et al., 2004; Biemans et al., 2011; Biemans, 2012; | ||
|Reference=OECD, 2012; Portmann et al., 2010; Fischer et al., 2005;Molden, 2007; FAO, 2011a; OECD, 2012; Sitch et al., 2003; Bondeau et al., 2007; | |Reference=OECD, 2012; Portmann et al., 2010; Fischer et al., 2005;Molden, 2007; FAO, 2011a; OECD, 2012; Sitch et al., 2003; Bondeau et al., 2007; | ||
| Line 12: | Line 12: | ||
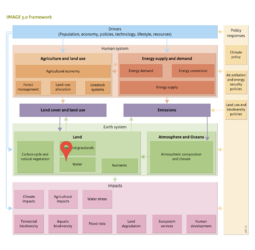
Although the total amount of fresh water on earth is more than enough to fulfil all human needs, it is the uneven distribution that makes water a scarce resource in some regions and watersheds. Climate change will lead to changes in precipitation patterns and, therefore, will also alter the future availability of water, adding to water stress in areas where precipitation levels are expected to decline. | Although the total amount of fresh water on earth is more than enough to fulfil all human needs, it is the uneven distribution that makes water a scarce resource in some regions and watersheds. Climate change will lead to changes in precipitation patterns and, therefore, will also alter the future availability of water, adding to water stress in areas where precipitation levels are expected to decline. | ||
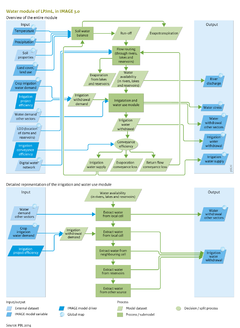
To identify current and future areas of water stress, IMAGE now includes a hydrological model that calculates both water availability and demand. The hydrological module of [[LPJml model|LPJmL]], coupled to the IMAGE model, is fully integrated with terrestrial carbon and land-use dynamics, and calculates agricultural water demand as well as water availability and withdrawals. Availability of renewable water is the net result of precipitation, interception and evapotranspiration by plants and soils. In the model, the surplus in each grid cell is flowing to neighbouring grid cells within a watersheds by means of a river routing scheme. River flows are modified by dams and reservoirs for irrigation, hydropower production or a mix of the two. The effects of water stress on crop production can be quantified by limiting the amount of available water for irrigation to the actually available amount of water in the LPJmL model. By including the feedback of water-limited crop production on land allocation, IMAGE is able to develop more realistic scenarios for cropland expansion and agricultural intensification in the future. The IMAGE model and the LPJmL model are fully and dynamically coupled (see [[ | To identify current and future areas of water stress, IMAGE now includes a hydrological model that calculates both water availability and demand. The hydrological module of [[LPJml model|LPJmL]], coupled to the IMAGE model, is fully integrated with terrestrial carbon and land-use dynamics, and calculates agricultural water demand as well as water availability and withdrawals. Availability of renewable water is the net result of precipitation, interception and evapotranspiration by plants and soils. In the model, the surplus in each grid cell is flowing to neighbouring grid cells within a watersheds by means of a river routing scheme. River flows are modified by dams and reservoirs for irrigation, hydropower production or a mix of the two. The effects of water stress on crop production can be quantified by limiting the amount of available water for irrigation to the actually available amount of water in the LPJmL model. By including the feedback of water-limited crop production on land allocation, IMAGE is able to develop more realistic scenarios for cropland expansion and agricultural intensification in the future. The IMAGE model and the LPJmL model are fully and dynamically coupled (see [[Carbon cycle and natural vegetation]]), and IMAGE scenarios therefore include an integral assessment of the water cycle, and can be used to assess water availability and water demand at high spatial (0.5 x 0.5 degree grid cells) and daily resolutions. | ||
==Links to other parts of the model, input and output== | ==Links to other parts of the model, input and output== | ||
The hydrological model of IMAGE is closely linked to the model on natural vegetation, crop and carbon cycles (see [[ | The hydrological model of IMAGE is closely linked to the model on natural vegetation, crop and carbon cycles (see [[Carbon cycle and natural vegetation]]; [[Crop and grass]]), because all those submodels are represented in LPJmL, which is a global hydrology and vegetation model ([[Sitch et al., 2003]]; [[Bondeau et al., 2007]]). | ||
An overview of data exchanges with other IMAGE modules is given below. Data on annual land cover and land use are used as input into LPJmL, including information on the location of irrigated areas and types of crops. This influences the amounts of water that evaporate and run off, as well as the amount of water needed for those irrigated areas. Vice versa, information on water availability as calculated by LPJmL is taken into account by the land allocation model to find suitable locations for the expansion of irrigated areas. Climate is used as an input into LPJmL to determine reference evapotranspiration, and the precipitation input to the water balance ([[Gerten et al., 2004]]). The crop model, which is also part of LPJmL ([[Crop and grass]]), calculates irrigation water demand based on crop characteristics, soil moisture and climate. If the amount of water available for irrigation is limited, the crop model calculates the reduction in crop yield due to water stress. | An overview of data exchanges with other IMAGE modules is given below. Data on annual land cover and land use are used as input into LPJmL, including information on the location of irrigated areas and types of crops. This influences the amounts of water that evaporate and run off, as well as the amount of water needed for those irrigated areas. Vice versa, information on water availability as calculated by LPJmL is taken into account by the land allocation model to find suitable locations for the expansion of irrigated areas. Climate is used as an input into LPJmL to determine reference evapotranspiration, and the precipitation input to the water balance ([[Gerten et al., 2004]]). The crop model, which is also part of LPJmL ([[Crop and grass]]), calculates irrigation water demand based on crop characteristics, soil moisture and climate. If the amount of water available for irrigation is limited, the crop model calculates the reduction in crop yield due to water stress. | ||
|ComponentCode=H | |ComponentCode=H | ||
Revision as of 09:05, 17 May 2014
| Component is implemented in: |
|
| Related IMAGE components |
| Projects/Applications |
| Key publications |
| References |
Key policy issues
- What is the combined effect of climate change and socio-economic development on water demand and availability, and on associated agricultural production?
- What is the potential of adaptation measures to reduce water stress and water-related crop production losses?
- How can water demand be reduced and still provide the adequate service levels to the sectors with the highest demand?