Terrestrial biodiversity/Data uncertainties limitations: Difference between revisions
Jump to navigation
Jump to search
No edit summary |
No edit summary |
||
| Line 1: | Line 1: | ||
{{ComponentDataUncertaintyAndLimitationsTemplate | {{ComponentDataUncertaintyAndLimitationsTemplate | ||
|Reference=Bartholome et al., 2004; DMA, 1992; Newbold et al., 2013; | |Reference=Bartholome et al., 2004; DMA, 1992; Newbold et al., 2013; | ||
|Description====Data=== | |Description====Data=== | ||
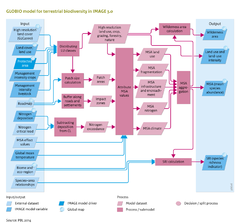
GLOBIO builds on data from literature reviews to construct relationships between biodiversity metrics ({{abbrTemplate|MSA}}) and environmental factors, such as land use, climate, and infrastructure. These are mainly local data on a large variety of ecosystems. Although systematically reviewed, representativeness is not guaranteed and bias may occur towards well-studied species groups, such as birds, and biodiversity-rich regions, such as tropical forests. | GLOBIO builds on data from literature reviews to construct relationships between biodiversity metrics ({{abbrTemplate|MSA}}) and environmental factors, such as land use, climate, and infrastructure. These are mainly local data on a large variety of ecosystems. Although systematically reviewed, representativeness is not guaranteed and bias may occur towards well-studied species groups, such as birds, and biodiversity-rich regions, such as tropical forests. | ||
GLOBIO input used for assessing the impact of scenarios on biodiversity stems from various IMAGE modules. This includes data on main drivers, such as land-use change (including cropland, grazing land and forests), climate change, and nitrogen deposition. Higher resolution data on land cover are derived from GLC2000 ([[Bartholome et al., 2004 | GLOBIO input used for assessing the impact of scenarios on biodiversity stems from various IMAGE modules. This includes data on main drivers, such as land-use change (including cropland, grazing land and forests), climate change, and nitrogen deposition. Higher resolution data on land cover are derived from GLC2000 ([[Bartholome et al., 2004]]), and data on infrastructure from the Digital Chart of the World ([[DMA, 1992]]). | ||
===Uncertainties=== | ===Uncertainties=== | ||
| Line 16: | Line 16: | ||
GLOBIO has indicators for species abundance (MSA), for the status of threatened species (SRI), and the natural and wilderness area is an indicator for the extent of relatively intact ecosystems. In principle, the GLOBIO model handles all ecosystems in the same way, reporting the relative reduction in MSA in relation to the natural state. Thus, the loss of natural area in a desert is awarded equal weight as the loss of a biodiversity hotspot in the tropics, although results can be presented per biome. This may be a controversial assumption, but there is no straight-forward method to weight ecosystems differently and it allows to assess a broad range of drivers and their effects on biodiversity in a consistent framework and on a global scale. | GLOBIO has indicators for species abundance (MSA), for the status of threatened species (SRI), and the natural and wilderness area is an indicator for the extent of relatively intact ecosystems. In principle, the GLOBIO model handles all ecosystems in the same way, reporting the relative reduction in MSA in relation to the natural state. Thus, the loss of natural area in a desert is awarded equal weight as the loss of a biodiversity hotspot in the tropics, although results can be presented per biome. This may be a controversial assumption, but there is no straight-forward method to weight ecosystems differently and it allows to assess a broad range of drivers and their effects on biodiversity in a consistent framework and on a global scale. | ||
To broaden the scope of GLOBIO, additional aspects, such as information on ecological traits of the species in the GLOBIO database, are used to address genetic diversity ([[Newbold et al., 2013]]). A methodology for projecting Red List Indices is now being developed. The strength of GLOBIO is that a broad range of drivers and their effects on biodiversity can be assessed in a consistent framework and on a global scale. | To broaden the scope of GLOBIO, additional aspects, such as information on ecological traits of the species in the GLOBIO database, are used to address genetic diversity ([[Newbold et al., 2013]]). A methodology for projecting Red List Indices is now being developed. The strength of GLOBIO is that a broad range of drivers and their effects on biodiversity can be assessed in a consistent framework and on a global scale. | ||
}} | }} | ||
Revision as of 20:42, 17 May 2014
Parts of Terrestrial biodiversity/Data uncertainties limitations
| Component is implemented in: |
|
| Projects/Applications |
| Key publications |
| References |