Energy demand/Description: Difference between revisions
Jump to navigation
Jump to search
m (Text replace - "|Status=Publishable" to "") |
m (Text replace - "Daioglou et al. (unpublished)" to "Daioglou et al., submitted") |
||
| Line 1: | Line 1: | ||
{{ComponentDescriptionTemplate | {{ComponentDescriptionTemplate | ||
|Reference=De Vries et al., 2001; Richels et al., 2004; Van Ruijven et al., 2013; Van Ruijven et al., 2011; Isaac and van Vuuren, 2009; Daioglou et al. | |Reference=De Vries et al., 2001; Richels et al., 2004; Van Ruijven et al., 2013; Van Ruijven et al., 2011; Isaac and van Vuuren, 2009; Daioglou et al., submitted; | ||
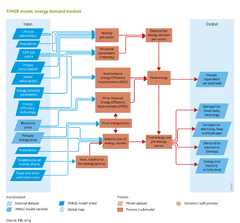
|Description=The energy demand model has aggregated formulations for some sectors and more detailed ones for others. First, a description of the generic model is provided, which is used for the service sector, part of the industrial sector (light) and in the category ‘other sectors’. Subsequently, discuss the more specific technology-rich descriptions of residential energy use, heavy industry and transport are discussed – indicating how the description in these models relates to elements of the generic model. | |Description=The energy demand model has aggregated formulations for some sectors and more detailed ones for others. First, a description of the generic model is provided, which is used for the service sector, part of the industrial sector (light) and in the category ‘other sectors’. Subsequently, discuss the more specific technology-rich descriptions of residential energy use, heavy industry and transport are discussed – indicating how the description in these models relates to elements of the generic model. | ||
| Line 33: | Line 33: | ||
Here, IMS is the indicated market share of different energy carriers (or technologies) and c is their ‘costs’. In this equation, λ represents the so-called logit parameter, determining the sensitivity of markets to price differences. In the equation, not only direct production costs are accounted for, but also energy and carbon taxes and so-called premium values. The last reflect non-price factors determining market shares, such as preferences, environmental policies, infrastructures (or the lack thereof) and strategic considerations. These premium values are determined in the model’s calibration process in order to simulate correctly historical market shares on the basis of simulated price information. The same parameters are used in scenarios as a way of simulating the assumption of societal preferences for clean and/or convenient fuels. The market shares of traditional biomass and secondary heat, in contrast, are determined by exogenous scenario parameters (except for the residential sector discussed below). | Here, IMS is the indicated market share of different energy carriers (or technologies) and c is their ‘costs’. In this equation, λ represents the so-called logit parameter, determining the sensitivity of markets to price differences. In the equation, not only direct production costs are accounted for, but also energy and carbon taxes and so-called premium values. The last reflect non-price factors determining market shares, such as preferences, environmental policies, infrastructures (or the lack thereof) and strategic considerations. These premium values are determined in the model’s calibration process in order to simulate correctly historical market shares on the basis of simulated price information. The same parameters are used in scenarios as a way of simulating the assumption of societal preferences for clean and/or convenient fuels. The market shares of traditional biomass and secondary heat, in contrast, are determined by exogenous scenario parameters (except for the residential sector discussed below). | ||
Non-energy use of energy carriers is modelled on the basis of exogenously assumed intensity of representative non-energy uses (chemicals) and on a price-driven competition between the various energy carriers ([[Daioglou et al. | Non-energy use of energy carriers is modelled on the basis of exogenously assumed intensity of representative non-energy uses (chemicals) and on a price-driven competition between the various energy carriers ([[Daioglou et al., submitted]]). | ||
==Heavy industry submodel== | ==Heavy industry submodel== | ||
The heavy industry submodel was implemented for the steel and cement sector ([[Van Ruijven et al., 2013]]). These two sectors represented about 8% of global energy use and 13% of global anthropogenic greenhouse gas emissions in 2005. The generic structure of the energy demand model was adapted in several ways: | The heavy industry submodel was implemented for the steel and cement sector ([[Van Ruijven et al., 2013]]). These two sectors represented about 8% of global energy use and 13% of global anthropogenic greenhouse gas emissions in 2005. The generic structure of the energy demand model was adapted in several ways: | ||
Revision as of 11:27, 2 May 2014
Parts of Energy demand/Description
| Component is implemented in: |
|
| Related IMAGE components |
| Projects/Applications |
| Key publications |
| References |