Energy supply/Description: Difference between revisions
Jump to navigation
Jump to search
No edit summary |
No edit summary |
||
| Line 14: | Line 14: | ||
==Trade== | ==Trade== | ||
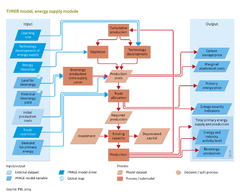
In the fuel trade model, each region imports fuels from other regions: the amount of fuel imported from each region depends on the relative production costs and those in other regions, augmented with transport costs, using multinomial logit equations. Transportation costs are calculated from representative interregional transport distances and time- and fuel-dependent estimates of the costs per GJ per kilometre. To reflect geographical, political and other constraints in the interregional fuel trade, an additional 'cost' is added to simulate the existence of trade barriers between regions (this costs factor is determined by calibration). Natural gas is transported by pipeline or liquid-natural gas (LNG) tanker, depending on transportation distances (for short distances, pipelines are more attractive). Finally, the model makes a comparison between the production costs with and without unrestricted trade. In cases where regions can supply at much lower costs than the average production costs in importing regions (a threshold of 60% is used), such regions are assumed to supply oil at a price only slightly below the production costs of the importing regions. Although this rule is implemented in a generic form for all energy carriers, it is only effective in the case of oil, where the behaviour of the OPEC cartel is simulated, to some degree. | In the fuel trade model, each region imports fuels from other regions: the amount of fuel imported from each region depends on the relative production costs and those in other regions, augmented with transport costs, using multinomial logit equations. Transportation costs are calculated from representative interregional transport distances and time- and fuel-dependent estimates of the costs per GJ per kilometre. To reflect geographical, political and other constraints in the interregional fuel trade, an additional 'cost' is added to simulate the existence of trade barriers between regions (this costs factor is determined by calibration). Natural gas is transported by pipeline or liquid-natural gas ([[HasAcronym::LNG]]) tanker, depending on transportation distances (for short distances, pipelines are more attractive). Finally, the model makes a comparison between the production costs with and without unrestricted trade. In cases where regions can supply at much lower costs than the average production costs in importing regions (a threshold of 60% is used), such regions are assumed to supply oil at a price only slightly below the production costs of the importing regions. Although this rule is implemented in a generic form for all energy carriers, it is only effective in the case of oil, where the behaviour of the OPEC cartel is simulated, to some degree. | ||
==Bio-energy== | ==Bio-energy== | ||
| Line 31: | Line 31: | ||
# Because only part of the energy can be extracted in the form of secondary energy carriers (fuel, electricity), due to limited conversion efficiency and maximum power density, part of the geographical potential cannot be used. This result of accounting for these conversion efficiencies is called the technical potential. | # Because only part of the energy can be extracted in the form of secondary energy carriers (fuel, electricity), due to limited conversion efficiency and maximum power density, part of the geographical potential cannot be used. This result of accounting for these conversion efficiencies is called the technical potential. | ||
# The final step is to relate this technical potential to on-site production costs. Information at grid level is then sorted and used as supply cost curves, to reflect the assumption that the lowest cost locations are exploited first. Supply cost curves are used dynamically and change over time as a result of the learning effect. | # The final step is to relate this technical potential to on-site production costs. Information at grid level is then sorted and used as supply cost curves, to reflect the assumption that the lowest cost locations are exploited first. Supply cost curves are used dynamically and change over time as a result of the learning effect. | ||
}} | }} | ||
Revision as of 15:49, 10 December 2013
Parts of Energy supply/Description
| Component is implemented in: |
|
| Related IMAGE components |
| Projects/Applications |
| Key publications |
| References |