Energy supply/Description: Difference between revisions
Jump to navigation
Jump to search
No edit summary |
Oostenrijr (talk | contribs) No edit summary |
||
| Line 7: | Line 7: | ||
<table class="pbltable"> | <table class="pbltable"> | ||
< | <div class="thumbcaption dark">Table: Main assumptions on fossil fuel resources ([[Rogner, 1997]]; [[Mulders et al., 2006]])</div> | ||
<tr><th> | <tr><th> | ||
</th><th>Oil | </th><th>Oil | ||
| Line 72: | Line 72: | ||
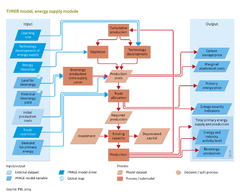
# The model assesses the part of the grid cell that can be used for energy production, given its physical–geographic (terrain, habitation) and socio-geographical (location, acceptability) characteristics. This leads to an estimate of the geographical potential. Several of these factors are scenario-dependent. The geographical potential for biomass production from energy crops is estimated using suitability/availability factors taking account of competing land-use options and the harvested rain-fed yield of energy crops. | # The model assesses the part of the grid cell that can be used for energy production, given its physical–geographic (terrain, habitation) and socio-geographical (location, acceptability) characteristics. This leads to an estimate of the geographical potential. Several of these factors are scenario-dependent. The geographical potential for biomass production from energy crops is estimated using suitability/availability factors taking account of competing land-use options and the harvested rain-fed yield of energy crops. | ||
# Next, we assume that only part of the geographical potential can be used due to limited conversion efficiency and maximum power density, This result of accounting for these conversion efficiencies is referred to as the technical potential. | # Next, we assume that only part of the geographical potential can be used due to limited conversion efficiency and maximum power density, This result of accounting for these conversion efficiencies is referred to as the technical potential. | ||
# The final step is to relate the technical potential to on-site production costs. Information at grid level is sorted and used as supply cost curves to reflect the assumption that the lowest cost locations are exploited first. Supply cost curves are used dynamically and change over time as a result of the learning effect. | # The final step is to relate the technical potential to on-site production costs. Information at grid level is sorted and used as supply cost curves to reflect the assumption that the lowest cost locations are exploited first. Supply cost curves are used dynamically and change over time as a result of the learning effect. | ||
}} | }} | ||
Revision as of 14:29, 24 June 2014
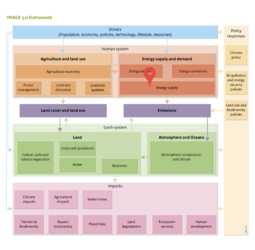
Parts of Energy supply/Description
| Component is implemented in: |
|
| Related IMAGE components |
| Projects/Applications |
| Key publications |
| References |