Terrestrial biodiversity/Description: Difference between revisions
Jump to navigation
Jump to search
Oostenrijr (talk | contribs) No edit summary |
Oostenrijr (talk | contribs) No edit summary |
||
| Line 1: | Line 1: | ||
{{ComponentDescriptionTemplate | {{ComponentDescriptionTemplate | ||
|Reference=Bartholome et al., 2004; UNEP-WCMC, 2005; Dixon et al., 2001; Visconti et al., 2011; Alkemade et al., 2012; Alkemade et al., 2011a; Bouwman et al., 2002b; Bobbink et al., 2010; DMA, 1992; Meijer and Klein Goldewijk, 2009; Benitez-Lopez et al., 2010; UNEP, 2001; Verboom et al., | |Reference=Bartholome et al., 2004; UNEP-WCMC, 2005; Dixon et al., 2001; Visconti et al., 2011; Alkemade et al., 2012; Alkemade et al., 2011a; Bouwman et al., 2002b; Bobbink et al., 2010; DMA, 1992; Meijer and Klein Goldewijk, 2009; Benitez-Lopez et al., 2010; UNEP, 2001; Verboom et al., 2014; Faith et al., 2008; Musters et al., submitted; | ||
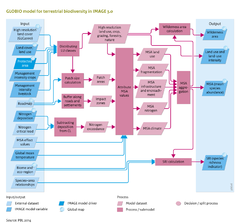
|Description=The GLOBIO model calculates changes in biodiversity in terrestrial ecosystems, based on seven drivers of biodiversity change: land-use change, land-use intensity, climate change, atmospheric nitrogen deposition, infrastructural development, encroachment and fragmentation. | |Description=The GLOBIO model calculates changes in biodiversity in terrestrial ecosystems, based on seven drivers of biodiversity change: land-use change, land-use intensity, climate change, atmospheric nitrogen deposition, infrastructural development, encroachment and fragmentation. | ||
Four steps in the model are distinguished: | Four steps in the model are distinguished: | ||
| Line 39: | Line 39: | ||
===Ecosystem fragmentation === | ===Ecosystem fragmentation === | ||
Conversion of natural land to intensive cropping and road construction change vast areas of contiguous wilderness into a fragmented landscape with remnants of natural areas remaining as isolated islands. These relatively small patches are likely to house fewer species than could be expected from their habitat quality, because the individual patches may be too small to sustain viable populations of some species. Based on literature data on minimum area requirements of species, a relationship is constructed between patch size and relative number of species compared to a non-fragmented situation, known as the minimum area requirement (MAR) curve ([[Verboom et al., | Conversion of natural land to intensive cropping and road construction change vast areas of contiguous wilderness into a fragmented landscape with remnants of natural areas remaining as isolated islands. These relatively small patches are likely to house fewer species than could be expected from their habitat quality, because the individual patches may be too small to sustain viable populations of some species. Based on literature data on minimum area requirements of species, a relationship is constructed between patch size and relative number of species compared to a non-fragmented situation, known as the minimum area requirement (MAR) curve ([[Verboom et al., 2014]]). The relative number of species in a certain patch according to this MAR curve is used as a proxy for mean species abundance (MSA). | ||
The area of natural vegetation patches is calculated by reclassifying the GLC2000 Global Land Cover data into two classes: human-dominated land (including croplands and urban areas) and natural land. Contiguous cells of natural land are grouped together and with an overlay of main roads (see above) are used to produce a map of natural land patches. | The area of natural vegetation patches is calculated by reclassifying the GLC2000 Global Land Cover data into two classes: human-dominated land (including croplands and urban areas) and natural land. Contiguous cells of natural land are grouped together and with an overlay of main roads (see above) are used to produce a map of natural land patches. | ||
In scenario projections, patch sizes change as agricultural land use expands and as new roads emerge ([[Verboom et al., | In scenario projections, patch sizes change as agricultural land use expands and as new roads emerge ([[Verboom et al., 2014]]). Changes in patch sizes also change the relative number of species and the MSA biodiversity indicator. | ||
===Aggregation=== | ===Aggregation=== | ||
Revision as of 09:15, 13 June 2018
Parts of Terrestrial biodiversity/Description
| Component is implemented in: |
|
| Projects/Applications |
| Key publications |
| References |
|