Energy supply: Difference between revisions
Oostenrijr (talk | contribs) No edit summary |
Oostenrijr (talk | contribs) No edit summary |
||
| Line 6: | Line 6: | ||
|Parameter=Initial production costs; | |Parameter=Initial production costs; | ||
|OutputVar=Primary energy price; Carbon storage price; Energy security indicators; Total primary energy supply; Marginal abatement cost; Energy and industry activity level; Bioenergy production; | |OutputVar=Primary energy price; Carbon storage price; Energy security indicators; Total primary energy supply; Marginal abatement cost; Energy and industry activity level; Bioenergy production; | ||
| | |ComponentCode=ES | ||
|AggregatedComponent=Energy supply and demand | |||
|FrameworkElementType=pressure component | |||
}} | |||
<div class="page_standard"> | |||
==Introduction== | |||
A key factor in future energy supply is the availability (and depletion) of various resources. One aspect is that energy resources are unevenly spread across world regions and often, poorly matched with regional energy demand. This is directly related to energy security. In representation of energy supply, the IMAGE energy model, describes long-term dynamics based on the interplay between resource depletion (upward pressure on prices) and technology development (downward pressure on prices). In the model, technology development is introduced in the form of learning curves for most fuels and renewable options. Costs decrease endogenously as a function of the cumulative energy capacity, and in some cases, assumptions are made about exogenous technology change. | |||
Depletion is a function of either cumulative production or annual production. For example, for fossil-fuel resources and nuclear feedstock, low-cost resources are slowly being depleted, and thus higher cost resources need to be used. In annual production, for example, of renewables, attractive production sites are used first. Higher annual production levels require use of less attractive sites with less wind or lower yields. | Depletion is a function of either cumulative production or annual production. For example, for fossil-fuel resources and nuclear feedstock, low-cost resources are slowly being depleted, and thus higher cost resources need to be used. In annual production, for example, of renewables, attractive production sites are used first. Higher annual production levels require use of less attractive sites with less wind or lower yields. | ||
It is assumed that all demand is always met. Because regions are usually unable to meet all of their own demand, energy carriers, such as coal, oil and gas, are widely traded. The impact of depletion and technology development lead to changes in primary fuel prices, which influence investment decisions in the end-use and energy-conversion modules Linkages to other parts of IMAGE framework include available land for bioenergy production, emissions of greenhouse gases and air pollutants (partly related to supply), and the use of land for bioenergy production (land use for other energy forms are not taken into account). Several key assumptions determine the long-term behaviour of the various energy supply submodules and are mostly related to technology development and resource base. | It is assumed that all demand is always met. Because regions are usually unable to meet all of their own demand, energy carriers, such as coal, oil and gas, are widely traded. The impact of depletion and technology development lead to changes in primary fuel prices, which influence investment decisions in the end-use and energy-conversion modules Linkages to other parts of IMAGE framework include available land for bioenergy production, emissions of greenhouse gases and air pollutants (partly related to supply), and the use of land for bioenergy production (land use for other energy forms are not taken into account). Several key assumptions determine the long-term behaviour of the various energy supply submodules and are mostly related to technology development and resource base. | ||
{{InputOutputParameterTemplate}} | |||
</div> | |||
}} | |||
Revision as of 17:29, 15 November 2018
| Component is implemented in: |
|
| Related IMAGE components |
| Projects/Applications |
| Key publications |
Key policy issues
- How can energy resources be exploited to meet future primary energy demand?
- How can energy supply and demand be balanced between world regions, and how will this effect security of supply?
- How rapidly can the transition to more sustainable energy supply be made?
Introduction
Introduction
A key factor in future energy supply is the availability (and depletion) of various resources. One aspect is that energy resources are unevenly spread across world regions and often, poorly matched with regional energy demand. This is directly related to energy security. In representation of energy supply, the IMAGE energy model, describes long-term dynamics based on the interplay between resource depletion (upward pressure on prices) and technology development (downward pressure on prices). In the model, technology development is introduced in the form of learning curves for most fuels and renewable options. Costs decrease endogenously as a function of the cumulative energy capacity, and in some cases, assumptions are made about exogenous technology change.
Depletion is a function of either cumulative production or annual production. For example, for fossil-fuel resources and nuclear feedstock, low-cost resources are slowly being depleted, and thus higher cost resources need to be used. In annual production, for example, of renewables, attractive production sites are used first. Higher annual production levels require use of less attractive sites with less wind or lower yields.
It is assumed that all demand is always met. Because regions are usually unable to meet all of their own demand, energy carriers, such as coal, oil and gas, are widely traded. The impact of depletion and technology development lead to changes in primary fuel prices, which influence investment decisions in the end-use and energy-conversion modules Linkages to other parts of IMAGE framework include available land for bioenergy production, emissions of greenhouse gases and air pollutants (partly related to supply), and the use of land for bioenergy production (land use for other energy forms are not taken into account). Several key assumptions determine the long-term behaviour of the various energy supply submodules and are mostly related to technology development and resource base.
Input/Output Table
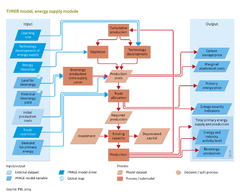
Input Energy supply component
| IMAGE model drivers and variables | Description | Source |
|---|---|---|
| Technology development of energy supply | Learning curves and exogenous learning that determine technology development. | Drivers |
| Learning rate | Determines the rate of technology development in learning equations. | Drivers |
| Energy resources | Volume of energy resource per carrier, region and supply cost class (determines depletion dynamics). | Drivers |
| Trade restriction | Trade tariffs and barriers limiting trade in energy carriers (in energy submodel). | Drivers |
| Potential bioenergy yield - grid | Potential yields of bioenergy crops. | Crops and grass |
| Land supply for bioenergy - grid | Land available for sustainable bioenergy production (abandoned agricultural land and non-forested land). | Land cover and land use |
| Demand for primary energy | Total demand for energy production. Sum of final energy demand and energy inputs into energy conversion processes. | Energy conversion |
| External datasets | Description | Source |
|---|---|---|
| Initial production costs | The costs of energy conversion technologies at the start of the simulation. | Various sources |
Output Energy supply component
| IMAGE model variables | Description | Use |
|---|---|---|
| Marginal abatement cost | Cost of an additional unit of pollution abated (CO2eq). A marginal abatement cost curve (MAC curve) is a set of options available to an economy to reduce pollution, ranked from the lowest to highest additional costs. | |
| Bioenergy production | Total bioenergy production. | |
| Energy and industry activity level | Activity levels in the energy and industrial sector, per process and energy carrier, for example, the combustion of petrol for transport or the production of crude oil. | |
| Primary energy price | The price of primary energy carriers based on production costs. | |
| Carbon storage price | The costs of capturing and storing CO2, affecting the use of CCS technology. | |
| Energy security indicators | Indicators on the status of energy security, such as energy self-sufficiency. | Final output |
| Total primary energy supply | Total primary energy supply. | Final output |