Human development/Description: Difference between revisions
Jump to navigation
Jump to search
No edit summary |
No edit summary |
||
| Line 15: | Line 15: | ||
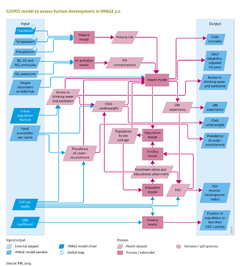
(i) Malaria risk. In GISMO, incidence rates of malaria are determined by the areas which are suitable for the malaria mosquito, based on the monthly climatic factors of temperature and precipitation ([[Craig et al., 1999]]). Incidence rates are decreased by the level of insecticide treated bed nets and indoor residual spraying, modelled separately as potential policy options. The case fatality rate of malaria is increased by underweight levels and decreased by case management, i.e. treatment. | (i) Malaria risk. In GISMO, incidence rates of malaria are determined by the areas which are suitable for the malaria mosquito, based on the monthly climatic factors of temperature and precipitation ([[Craig et al., 1999]]). Incidence rates are decreased by the level of insecticide treated bed nets and indoor residual spraying, modelled separately as potential policy options. The case fatality rate of malaria is increased by underweight levels and decreased by case management, i.e. treatment. | ||
(ii) Access to food, water and energy. GISMO relates incidence and case fatality rates of major communicable (infectious) diseases to access to food, water and energy (see Table), with access defined by per-capita food availability, access to safe drinking water and improved sanitation, and access to modern energy sources for cooking and heating. The per-capita food availability (Kcal/cap/day) is obtained from the IMAGE model (Section 4.2). The levels of access to safe drinking water and improved sanitation are modelled separately by applying linear regression. The explanatory variables include GDP per capita, urbanisation rate and population density. Developments in water supply are assumed to be implemented ahead of sanitation. As such, developments in access follow a pathway from no sustainable access to safe drinking water and basic sanitation, to improved water supply only, improved water supply and sanitation, household connection for water supply only, and to a household connection for watersupply and sanitation. The level of access to modern energy sources for cooking and heating distinguishes between the use of 1) traditional biomass and coal on traditional stoves; 2) traditional biomass and coal on improved stoves; and 3) the use of modern energy carriers (electricity, natural gas, LPG, kerosene, modern biofuels and decentralised renewable sources). Trends in access to modern energy sources are taken from the TIMER residential model | (ii) Access to food, water and energy. GISMO relates incidence and case fatality rates of major communicable (infectious) diseases to access to food, water and energy (see Table), with access defined by per-capita food availability, access to safe drinking water and improved sanitation, and access to modern energy sources for cooking and heating. The per-capita food availability (Kcal/cap/day) is obtained from the IMAGE model (Section 4.2). The levels of access to safe drinking water and improved sanitation are modelled separately by applying linear regression. The explanatory variables include GDP per capita, urbanisation rate and population density. Developments in water supply are assumed to be implemented ahead of sanitation. As such, developments in access follow a pathway from no sustainable access to safe drinking water and basic sanitation, to improved water supply only, improved water supply and sanitation, household connection for water supply only, and to a household connection for watersupply and sanitation. The level of access to modern energy sources for cooking and heating distinguishes between the use of 1) traditional biomass and coal on traditional stoves; 2) traditional biomass and coal on improved stoves; and 3) the use of modern energy carriers (electricity, natural gas, LPG, kerosene, modern biofuels and decentralised renewable sources). Trends in access to modern energy sources are taken from the TIMER residential [[Energy demand]] model. | ||
{{FigureTemplate|Table_HD.png}} | {{FigureTemplate|Table_HD.png}} | ||
Revision as of 12:51, 9 December 2013
Parts of Human development/Description
| Component is implemented in: |
|
| Related IMAGE components |
| Projects/Applications |
| Models/Databases |
| Key publications |
| References |