Drivers/Scenario drivers: Difference between revisions
< Drivers
Jump to navigation
Jump to search
No edit summary |
No edit summary |
||
| Line 2: | Line 2: | ||
|PageLabel=Scenario drivers | |PageLabel=Scenario drivers | ||
|Sequence=2 | |Sequence=2 | ||
|Reference=PBL, 2010; OECD, 2008; | |Reference=PBL, 2010; PBL, 2011; OECD, 2008; Moss et al., 2010; IIASA, 2013; UN, 2013; Lutz and KC, 2010; Van Vuuren et al., 2007b; OECD, 2012; | ||
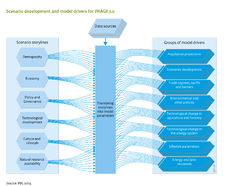
|Description={{DisplayFigureTemplate|Flowchart D}} | |Description={{DisplayFigureTemplate|Flowchart D}} | ||
<h2>Scenario drivers</h2> | <h2>Scenario drivers</h2> | ||
| Line 43: | Line 43: | ||
In IMAGE 3.0, renewable and non-renewable energy resources are modelled by volume and price, see Component [[Energy supply]]. Similarly, the potential land for agriculture ranked according to suitability and is subject to nature conservation policies, limits future land conversion, see Component [[Agricultural systems]]. | In IMAGE 3.0, renewable and non-renewable energy resources are modelled by volume and price, see Component [[Energy supply]]. Similarly, the potential land for agriculture ranked according to suitability and is subject to nature conservation policies, limits future land conversion, see Component [[Agricultural systems]]. | ||
Revision as of 12:57, 9 May 2014
Parts of Drivers/Scenario drivers
| Projects/Applications |
| Models/Databases |
| Relevant overviews |
| Key publications |
| References |