Drivers/Model drivers: Difference between revisions
< Drivers
Jump to navigation
Jump to search
No edit summary |
No edit summary |
||
| Line 2: | Line 2: | ||
|PageLabel=Model drivers | |PageLabel=Model drivers | ||
|Sequence=3 | |Sequence=3 | ||
|Reference=FAO, 2013a; Bruinsma, 2003; Alexandratos and Bruinsma, 2012; | |Reference=FAO, 2013a; Bruinsma, 2003; Alexandratos and Bruinsma, 2012; | ||
|Description=<h2>Model drivers</h2> | |Description=<h2>Model drivers</h2> | ||
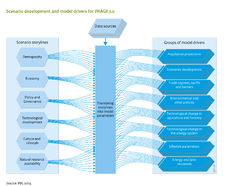
Direct model drivers are inferred from the scenario drivers and used in setting the parameter values in IMAGE 3.0. The start values are estimated from the literature and data, and future changes in values are inferred from the narratives and scenario drivers. The resulting parameter values are used as input for different parts of IMAGE 3.0. A list of most important model drivers, their source and their use in [[Framework overview]]|IMAGE | Direct model drivers are inferred from the scenario drivers and used in setting the parameter values in IMAGE 3.0. The start values are estimated from the literature and data, and future changes in values are inferred from the narratives and scenario drivers. The resulting parameter values are used as input for different parts of IMAGE 3.0. A list of most important model drivers, their source and their use in [[Framework overview]]is given in Table model drivers below. | ||
<pre> | |||
===Example of a model driver: technological change in agriculture=== | |||
The management factor ({{AbbrTemplate|MF}}) describes the actual yield per crop group and per socio-economic region as a proportion of the maximum potential yield. This maximum potential yield is estimated taking into account inhomogeneous soil and climate data across grid cells. The MF for the period up to 2005 is estimated as part of the IMAGE calibration procedure, using FAO statistics on actual crop yields and crop areas ([[FAO, 2013a]]). The start year for the MF is subsequently taken as point of departure for future projections. | |||
===Example of a model driver: technological change in agriculture=== | Guidance for future development of yield changes is provided by expert projection such as the assumptions in FAO projections up to 2030 and 2050 ([[Bruinsma, 2003]]; [[Alexandratos and Bruinsma, 2012]]).The FAO trends are used as exogenous technical development in the [[MAGNET model]], and subsequently adjusted to reflect the relative shortage of suitable land, as part of the model calculation (Component [[Agricultural economy and forestry]]). The combinations of production volumes and land areas from MAGNET are adopted as future MF projections into the future in IMAGE. | ||
Future technological change is dependent on the storyline and needs to be consistent with other scenario drivers. For instance, strong economic growth is typically facilitated by rapid technology development and deployment, rising wages and a labour shift from primary production (agriculture) to secondary (industry) and tertiary (services) sectors. These developments foster more advanced management and technology in agriculture. In order to reflect different trends in exogenous yield increase, FAO trends are combined with projections of economic growth to develop scenario-specific trends of yield changes in multiple—baseline studies, like for the {{AbbrTemplate|SSP}}s. Because the MF is such a decisive factor in future net agricultural land area, careful consideration of uncertainties is warranted. | |||
</pre> | |||
|IMAGE components]] is given in the 'Table of drivers' below_===Example of a model driver: technological change in agriculture=== | |||
The management factor ({{AbbrTemplate|MF}}) describes the actual yield per crop group and per socio-economic region as a proportion of the maximum potential yield. This maximum potential yield is estimated taking into account inhomogeneous soil and climate data across grid cells. The MF for the period up to 2005 is estimated as part of the IMAGE calibration procedure, using FAO statistics on actual crop yields and crop areas ([[FAO, 2013a]]). The start year for the MF is subsequently taken as point of departure for future projections. | The management factor ({{AbbrTemplate|MF}}) describes the actual yield per crop group and per socio-economic region as a proportion of the maximum potential yield. This maximum potential yield is estimated taking into account inhomogeneous soil and climate data across grid cells. The MF for the period up to 2005 is estimated as part of the IMAGE calibration procedure, using FAO statistics on actual crop yields and crop areas ([[FAO, 2013a]]). The start year for the MF is subsequently taken as point of departure for future projections. | ||
Revision as of 13:21, 9 May 2014
Parts of Drivers/Model drivers
| Projects/Applications |
| Models/Databases |
| Relevant overviews |
| Key publications |
| References |