Drivers/Scenario drivers: Difference between revisions
< Drivers
Jump to navigation
Jump to search
Oostenrijr (talk | contribs) No edit summary |
Oostenrijr (talk | contribs) No edit summary |
||
| Line 2: | Line 2: | ||
|PageLabel=Scenario drivers | |PageLabel=Scenario drivers | ||
|Sequence=2 | |Sequence=2 | ||
|Reference=PBL, 2010; PBL, 2011; OECD, 2008; Moss et al., 2010; IIASA, 2013; UN, 2013; Lutz and KC, 2010; Van Vuuren et al., 2007b; | |Reference=PBL, 2010; PBL, 2011; OECD, 2008; Moss et al., 2010; IIASA, 2013; UN, 2013; Lutz and KC, 2010; Van Vuuren et al., 2007b; Chateau et al., 2013; | ||
|Description=<h2>Scenario drivers</h2> | |Description=<h2>Scenario drivers</h2> | ||
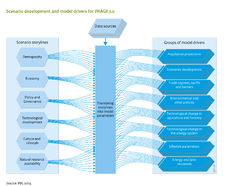
On the basis of how the world may develop in the longer term, the following six key scenario drivers are distinguished: demography, economy, culture and lifestyle, natural resource availability, technological development, and policy and governance, see flowchart. The future direction of these drivers is often inferred from the storyline or narrative, which may range from brief to very detailed. The storyline describes the following scenario types and functions: | On the basis of how the world may develop in the longer term, the following six key scenario drivers are distinguished: demography, economy, culture and lifestyle, natural resource availability, technological development, and policy and governance, see flowchart. The future direction of these drivers is often inferred from the storyline or narrative, which may range from brief to very detailed. The storyline describes the following scenario types and functions: | ||
| Line 21: | Line 21: | ||
===Economy=== | ===Economy=== | ||
At the most aggregated level, economic activity is described in terms of [[GDP per capita|gross domestic product (GDP) per capita]]. Models outside the IMAGE 3.0 framework, such as the [[ENV-Linkages model|OECD ENV-Growth model]], project long-term GDP growth based on developments in key production factors (e.g., capital, labour, natural resources), and the sector composition of the economy. The various components of GDP on the production side (in particular value added (VA) per sector) and expenditures (in particular private consumption) are estimated with more detailed models that take account of inter-sector linkages, own- and cross-price responses, and other factors [[Chateau et al., 2013]]. | At the most aggregated level, economic activity is described in terms of [[GDP per capita|gross domestic product (GDP) per capita]]. Models outside the IMAGE 3.0 framework, such as the [[ENV-Linkages model|OECD ENV-Growth model]], project long-term GDP growth based on developments in key production factors (e.g., capital, labour, natural resources), and the sector composition of the economy. The various components of GDP on the production side (in particular value added (VA) per sector) and expenditures (in particular private consumption) are estimated with more detailed models that take account of inter-sector linkages, own- and cross-price responses, and other factors [[Chateau et al., 2013]]. | ||
In IMAGE 3.0, economic variables are used as model drivers for the [[energy demand]] model , and non-agricultural water demand contributing to water stress, see ([[Water|Water model]]. To meet the requirements of the household energy demand model, average income is broken down into urban and rural population, and each population into quintiles of income levels. The latter is derived from the assumed uneven income distribution using the [[GINI]] factor, a measure of income disparity in a population. The macro indicator GDP per capita is also used directly in IMAGE components, such as [[human health]], [[flood | In IMAGE 3.0, economic variables are used as model drivers for the [[energy demand]] model , and non-agricultural water demand contributing to water stress, see ([[Water|Water model]]. To meet the requirements of the household energy demand model, average income is broken down into urban and rural population, and each population into quintiles of income levels. The latter is derived from the assumed uneven income distribution using the [[GINI cofficient|GINI]] factor, a measure of income disparity in a population. The macro indicator GDP per capita is also used directly in IMAGE components, such as [[Human development|human health]], [[flood risks]], and [[nutrients]] (for calculating urban wastewater). The agriculture model [[MAGNET]] is an economy-wide computable general equilibrium (CGE) model that reproduces exogenous GDP growth projections made in less complex economic growth models, see [[Agricultural economy]]. | ||
===Policy and governance=== | ===Policy and governance=== | ||
| Line 49: | Line 49: | ||
===Relationships between scenario drivers=== | ===Relationships between scenario drivers=== | ||
Assumptions made in one of the six scenario drivers depend, to a lesser or greater extent, on assumptions in one or more of the other scenario drivers. Thus, the plausibility of a set of drivers and of an individual driver hinges on careful consideration of the nature and direction of these relationships. An overarching story or narrative has proven helpful in selecting meaningful combinations of scenario drivers ([[IPCC, 2000]]; [[MA, 2005]]). | Assumptions made in one of the six scenario drivers depend, to a lesser or greater extent, on assumptions in one or more of the other scenario drivers. Thus, the plausibility of a set of drivers and of an individual driver hinges on careful consideration of the nature and direction of these relationships. An overarching story or narrative has proven helpful in selecting meaningful combinations of scenario drivers ([[IPCC, 2000]]; [[MA, 2005]]). | ||
}} | }} | ||
Revision as of 15:15, 16 June 2016
Parts of Drivers/Scenario drivers
| Projects/Applications |
| Models/Databases |
| Relevant overviews |
| Key publications |
| References |
