Drivers: Difference between revisions
Jump to navigation
Jump to search
No edit summary |
No edit summary |
||
| Line 3: | Line 3: | ||
|ComponentCode=D | |ComponentCode=D | ||
|IMAGEComponent=Agriculture and land use; | |IMAGEComponent=Agriculture and land use; | ||
|Reference=Ten Brink et al., 2010; OECD, 2008a; OECD, 2012; UNEP, 2011; Westhoek et al., 2011; | |ExternalModel=ENV-Growth; MAGNET; | ||
|Reference=Ten Brink et al., 2010; OECD, 2008a; OECD, 2012; UNEP, 2011; Westhoek et al., 2011; Aiking, 2011; Chateau, 2013 | |||
|FrameworkElementType=driver | |FrameworkElementType=driver | ||
|Description===Introduction== | |Description===Introduction== | ||
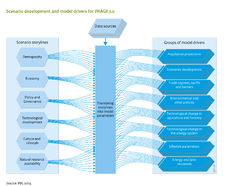
In order for the IMAGE model to explore future scenarios, exogenous assumptions need to be made for a range of factors that shape the direction and rate of change in key model variables and results. Together with the endogenous functional relationships and endogenous model parameters that jointly typify the behaviour of the model, these exogenous assumptions drive the outcome of any particular model calculation. In other words, these assumptions are the drivers that determine the model results subject to the assumed external conditions. | In order for the IMAGE model to explore future scenarios, exogenous assumptions need to be made for a range of factors that shape the direction and rate of change in key model variables and results. Together with the endogenous functional relationships and endogenous model parameters that jointly typify the behaviour of the model, these exogenous assumptions drive the outcome of any particular model calculation. In other words, these assumptions are the drivers that determine the model results subject to the assumed external conditions. | ||
For IMAGE, six groups of assumptions are distinguished that make up the scenario drivers. In this chapter these six scenario drivers will be described. These drivers are the basis of any scenario and are generally rooted in a scenario narrative or storyline. This includes cases where current trends and dynamics are assumed to continue into the future; commonly referred to as reference or ‘business-as-usual’ cases. As a rule, scenario drivers do not constitute numerical model inputs, but they do govern in qualitative or semi-quantitative terms the more elaborate set of exogenous assumptions in terms of model input files for the various parts of the model framework. In other words, numerical model drivers for any specific scenario will need to be established on the basis of the six more generic scenario drivers. The model drivers for the various modules are explained in more detail in the | For IMAGE, six groups of assumptions are distinguished that make up the scenario drivers. In this chapter these six scenario drivers will be described. These drivers are the basis of any scenario and are generally rooted in a scenario narrative or storyline. This includes cases where current trends and dynamics are assumed to continue into the future; commonly referred to as reference or ‘business-as-usual’ cases. As a rule, scenario drivers do not constitute numerical model inputs, but they do govern in qualitative or semi-quantitative terms the more elaborate set of exogenous assumptions in terms of model input files for the various parts of the model framework. In other words, numerical model drivers for any specific scenario will need to be established on the basis of the six more generic scenario drivers. The model drivers for the various modules are explained in more detail in the model components (these can be accessed via [[Components_Overview]]) . The scenario drivers and underlying narrative, together with the concrete quantitative model drivers form a scenario, inextricably linked with the results from the IMAGE scenario run. | ||
==Scenario drivers== | ==Scenario drivers== | ||
| Line 16: | Line 17: | ||
The future state of the world will depend on how many people are expected to populate the world, as all –average- per capita activities scales with the number of people to obtain regional and global demands for goods and services. Typically the population projections that are used as input to drive the IMAGE model are adopted from published sources such as UN and IIASA. Behind these numerical projections are economic, technical, educational and policy assumptions that influence the estimated future population as the net outcome of fertility and mortality, adjusted for migration flows. This provides internally consistent, or at least plausible, overall population scenarios on the basis of underlying demographic trends. At the level of model drivers, besides the total population size the breakdown over gender, income classes, urban/ rural split, and the level of education matter for such issues as consumption preferences and patterns, and access to goods and services. With use of a downscaling procedure, the population at country or regional level is also available at the grid level; see [[IMAGE_framework_summary]]. Population data are used in the energy- and agricultural economics modeling, but also directly in various other modules of IMAGE such as water stress, nutrients, flood risks and human health. | The future state of the world will depend on how many people are expected to populate the world, as all –average- per capita activities scales with the number of people to obtain regional and global demands for goods and services. Typically the population projections that are used as input to drive the IMAGE model are adopted from published sources such as UN and IIASA. Behind these numerical projections are economic, technical, educational and policy assumptions that influence the estimated future population as the net outcome of fertility and mortality, adjusted for migration flows. This provides internally consistent, or at least plausible, overall population scenarios on the basis of underlying demographic trends. At the level of model drivers, besides the total population size the breakdown over gender, income classes, urban/ rural split, and the level of education matter for such issues as consumption preferences and patterns, and access to goods and services. With use of a downscaling procedure, the population at country or regional level is also available at the grid level; see [[IMAGE_framework_summary]]. Population data are used in the energy- and agricultural economics modeling, but also directly in various other modules of IMAGE such as water stress, nutrients, flood risks and human health. | ||
===Economics=== | |||
At the most aggregate level, the level of economic activity is typically described in terms of GDP (Gross Domestic Product) per capita. Models outside the IMAGE 3.0 framework estimate long-term GDP growth perspectives, following from development of the key production factors (e.g. capital, labour, natural resources) and the sectoral composition of the economy; such as the ENV-Growth model of the OECD. The overall GDP is composed of Value Added (VA) per relevant sector and private consumption, estimated with more detailed models accounting for intersectoral linkages, responses to prices, and others (Chateau, 2013).. Economic variables are used as model drivers for the [[Energy demand| energy demand]] model , and the non-agricultural water demand contributing to water stress (model component [[Hydrology]]). For the household energy demand model, the average income is broken down into urban and rural population, and for each into quintiles of income levels. The latter is derived from the assumed, uneven income distribution by means of the so-called GINI factor. The GINI factor is a measure of income disparity in a population. If all enjoy the same income, GINI equals unity. The lower the GINI is, the wider is the gap between the lowest and highest income groups. The agricultural economy model MAGNET is in fact an economy-wide Computable General Equilibrium (CGE) model, that is able to reproduce the exogenous GDP growth projections made with the less complex economic growth models; see model component [[Agricultural economy and forestry]] . The macro indicator GDP/capita is also used directly in various other IMAGE modules, such as nutrients in urban wastewater, human health, and flood risks . | |||
===Culture and lifestyle=== | |||
For comparable levels of affluence, the observed behaviour of societies with respect to consumption differs strongly between countries and regions, and to a lesser extent also within countries. The modal split of passenger transport between walking, cycling, cars, buses, trains, boats and planes depend on income, but also on traditions and habits engrained in social groups. Preference for different foodstuffs depends on availability and affordability, but also strongly on cultural factors. These may be inspired by religion (no pork for Jewish and Islamic households; no beef or no meat at all for Hindus; etc.), but also by tradition, public moral and health concerns. In addition, concerns over environmental degradation, animal welfare, inter-regional and intergenerational equity and other issues can influence actual behavior, in accordance with dominant societal norms and values. Consumer preferences and lifestyles can change over time, as norms and values can change. The direction and rate of such changes can be inferred from the underlying scenario storyline. Policies may be put in place to enable, encourage or even enforce such changes, given sufficient public support. | |||
Culture and lifestyle | |||
Natural resource availability | Natural resource availability | ||
Revision as of 15:07, 31 July 2013
| Projects/Applications |
| Models/Databases |
| Relevant overviews |
| Key publications |
Introduction
"driver" is not in the list (driver component, pressure component, interaction component, state component, impact component, response component) of allowed values for the "FrameworkElementType" property.