Drivers/Policy issues: Difference between revisions
< Drivers
Jump to navigation
Jump to search
No edit summary |
No edit summary |
||
| Line 8: | Line 8: | ||
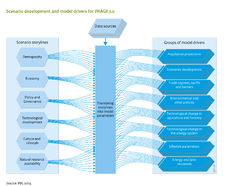
Recently, the Shared Socioeconomic Pathways ({{AbbrTemplate|SSP}}s) have been developed to support climate change research by different research communities ([[Moss et al., 2010]]; [[Van Vuuren et al., 2012]]; [[Ebi et al., 2013]]). See both Figures below. The qualitative narratives or storylines characterising alternative futures are important elements of the SSPs From there, assumptions are made about internally coherent sets of scenario drivers, and key model drivers, such as population and {{AbbrTemplate|GDP}} growth ([[IIASA, 2013]]) | Recently, the Shared Socioeconomic Pathways ({{AbbrTemplate|SSP}}s) have been developed to support climate change research by different research communities ([[Moss et al., 2010]]; [[Van Vuuren et al., 2012]]; [[Ebi et al., 2013]]). See both Figures below. The qualitative narratives or storylines characterising alternative futures are important elements of the SSPs From there, assumptions are made about internally coherent sets of scenario drivers, and key model drivers, such as population and {{AbbrTemplate|GDP}} growth ([[IIASA, 2013]]) | ||
===Population projections=== | |||
The wide range of long-term populations projections is presented in Figure below. By 2100, the world population could be either about the same as today or double. The projections were made by IIASA using a population modelling approach ([[Lutz and KC, 2010]]) that links aggregate education levels to fertility and mortality rates per country. Together with migration flows, these rates determine the size of the future population. ([[Dellink et al., forthcoming]]; [[KC and Lutz, forthcoming]]). | The wide range of long-term populations projections is presented in Figure below. By 2100, the world population could be either about the same as today or double. The projections were made by IIASA using a population modelling approach ([[Lutz and KC, 2010]]) that links aggregate education levels to fertility and mortality rates per country. Together with migration flows, these rates determine the size of the future population. ([[Dellink et al., forthcoming]]; [[KC and Lutz, forthcoming]]). | ||
Using population projections and the underlying educational attainment per age cohort, long-term economic growth models project economic development expressed as GDP per capita. For the SSPs, economic development up to 2100 has been calculated by three different teams at [[OECD]], [[IIASA]] and [[PIK]], using their own models. GDP projections from the OECD model [[ENV-Growth model|ENV-Growth]]([[Dellink et al., forthcoming]]) differ by a factor of up to 3.7 (see Figure at the bottom, left). The differences in population and economic growth rates between countries and regions mean that the distribution of total economic assets is likely to shift, with Asia in the lead, followed later by Africa and, to a lesser extent, by Latin America (see Figure at the bottom, middle). | Using population projections and the underlying educational attainment per age cohort, long-term economic growth models project economic development expressed as GDP per capita. For the SSPs, economic development up to 2100 has been calculated by three different teams at [[OECD]], [[IIASA]] and [[PIK]], using their own models. GDP projections from the OECD model [[ENV-Growth model|ENV-Growth]]([[Dellink et al., forthcoming]]) differ by a factor of up to 3.7 (see Figure at the bottom, left). The differences in population and economic growth rates between countries and regions mean that the distribution of total economic assets is likely to shift, with Asia in the lead, followed later by Africa and, to a lesser extent, by Latin America (see Figure at the bottom, middle). | ||
=== Models, scenario story lines and results=== | |||
As different models have been used, we can investigate how different model structures and assumptions and different interpretations of the qualitative scenario storylines in model parameters lead to quite different results (see Figure at the bottom, right). Projections for the SSP3 scenario made by different teams not only differ with respect to the levels projected for 2100, but also with respect to the profile over the century. | As different models have been used, we can investigate how different model structures and assumptions and different interpretations of the qualitative scenario storylines in model parameters lead to quite different results (see Figure at the bottom, right). Projections for the SSP3 scenario made by different teams not only differ with respect to the levels projected for 2100, but also with respect to the profile over the century. | ||
Revision as of 15:54, 9 May 2014
Parts of Drivers/Policy issues
| Projects/Applications |
| Models/Databases |
| Relevant overviews |
| Key publications |
| References |