Human development/Description: Difference between revisions
Jump to navigation
Jump to search
No edit summary |
Oostenrijr (talk | contribs) No edit summary |
||
| Line 54: | Line 54: | ||
===Access to food, water and energy=== | ===Access to food, water and energy=== | ||
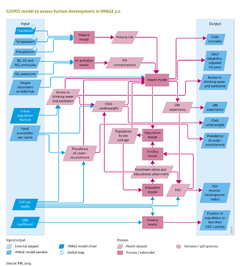
GISMO relates incidence and case fatality rates for specific diseases to access to food, water and energy ( | GISMO relates incidence and case fatality rates for specific diseases to access to food, water and energy (the table above). Access is defined by per capita food availability, access to safe drinking water and improved sanitation, and access to modern energy sources for cooking and heating. The future per capita food availability (Kcal/cap/day) is obtained from IMAGE (Component [[Agriculture and land use]]). The levels of access to safe drinking water and improved sanitation are modelled separately by applying linear regression. The explanatory variables include GDP per capita, urbanisation rate and population density. Improvements in water supply are assumed to be implemented ahead of sanitation. Access to water supply and sanitation follows a pathway from no sustainable access to safe drinking water and basic sanitation, to improved water supply only, improved water supply and sanitation, household connection for water supply, to household connection to water supply and sanitation. Three levels of access to modern energy sources for cooking and heating are distinguished: traditional biomass and coal on traditional stoves; traditional biomass and coal on improved stoves; and use of modern energy carriers (electricity, natural gas, LPG, kerosene, modern biofuels and decentralised renewable sources). Trends in access to modern energy sources are taken from the TIMER [[energy demand]] module. | ||
====Underweight children and prevalence of undernourishment==== | ====Underweight children and prevalence of undernourishment==== | ||
| Line 70: | Line 70: | ||
===GISMO education module=== | ===GISMO education module=== | ||
The education module assesses future developments in school enrolment and educational attainment, including literacy rates at three levels of education: primary, secondary and tertiary. The model tracks the proportion of the highest level of education completed and the average number of years of schooling per cohort. The enrolment ratios per educational level are determined using cross-sectional relationships with per-capita GDP (PPP). The age at which a certain educational level is attained is assumed to be identical in all regions. Literacy rates are determined by the proportion of the population over the age of 15 who have completed at least primary education. Furthermore, to take account of autonomous increases in literacy levels, literacy levels of the population between the age of 15 and 65 is increased by 0.3%, annually. | The education module assesses future developments in school enrolment and educational attainment, including literacy rates at three levels of education: primary, secondary and tertiary. The model tracks the proportion of the highest level of education completed and the average number of years of schooling per cohort. The enrolment ratios per educational level are determined using cross-sectional relationships with per-capita GDP (PPP). The age at which a certain educational level is attained is assumed to be identical in all regions. Literacy rates are determined by the proportion of the population over the age of 15 who have completed at least primary education. Furthermore, to take account of autonomous increases in literacy levels, literacy levels of the population between the age of 15 and 65 is increased by 0.3%, annually. | ||
}} | }} | ||
Revision as of 14:31, 24 June 2014
Parts of Human development/Description
| Component is implemented in: |
|
| Related IMAGE components |
| Projects/Applications |
| Models/Databases |
| Key publications |
| References |