Atmospheric composition and climate/Description
Parts of Atmospheric composition and climate/Description
| Component is implemented in: |
|
| Related IMAGE components |
| Projects/Applications |
| Models/Databases |
| Key publications |
| References |
Model description of Atmospheric composition and climate
Atmospheric gas concentrations
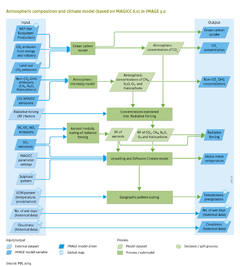
The IMAGE climate model (based on MAGICC 6.0, Meinshausen et al., 2011a) calculates atmospheric CO2 concentration based on CO2 emission data for energy, industry and land-use change (ComponentEmissions); terrestrial carbon balance (Component Carbon cycle and natural vegetation); and carbon uptake by the oceans (calculated in MAGICC on the basis of the Bern Ocean Carbon model).
Concentrations of other long-lived greenhouse gases (CH4, N2O, and halocarbons), and tropospheric ozone (O3) precursors (CO, NMVOC) are calculated by MAGICC in a simple atmospheric chemistry module. Halocarbons and N2O concentrations mostly show a simple mass-concentration conversion and half-life behaviour. CH4 and ozone dynamics are more complex, with CH4 lifetime depending on the OH concentration level, and O3 and OH concentration levels depending on CH4 concentrations, and NOx, CO and NMVOC emissions (Meinshausen et al., 2011b).
Atmospheric energy balance
Change in atmospheric gas concentrations also changes the amount of radiation absorbed or transmitted by the atmosphere, and thus changes the earth’s energy balance and temperature. The energy balance change is expressed as radiative forcing per gas, measured in W/m2. In MAGICC, concentrations of long-lived greenhouse gases are translated into radiative forcing values using radiative efficiency estimates from the IPCC (Myhre et al., 2013), and radiative forcing of tropospheric ozone is calculated based on ozone sensitivity factors from MAGICC6.0 (Meinshausen et al., 2011a; Meinshausen et al., 2011b).
However, other processes also lead to changes in the atmospheric energy balance, which are also modelled and assigned a radiative forcing value. Aerosols, such as SO2, NOx, and organic carbon, have a direct cooling effect by reflecting more radiation back into space (direct aerosol effect). They also interact with clouds and precipitation in many ways (indirect aerosol effect); this cloud feedback is the largest source of uncertainty in estimating climate sensitivity (Denman et al., 2007). Although also an aerosol, black carbon has a strong direct warming effect (WMO/UNEP, 2013).
Direct and the indirect aerosol effects are approximated in MAGICC by scaling the radiative forcing in a reference year (mostly 2005) with the relative increase in future emissions with respect to emissions in the reference year. As MAGICC assumes radiative forcing by albedo and mineral dust to stay constant over the scenario period (Meinshausen et al., 2011a), this is also assumed in IMAGE.
Global mean temperature change
The core of MAGICC 6.0, the upwelling–diffusion climate model, calculates change in global mean temperature as a result of these radiative forcings (Meinshausen et al., 2011a; Meinshausen et al., 2011b). It is a ‘four-box’ model, representing the earth by a northern and southern land component, and a northern and southern ocean component.
The energy fluxes simulated by MAGICC include heat transport from the atmosphere through the mixing top layer of the ocean to lower water layers (60 layers), and heat transfer between land and ocean. Because of the slow heat transport to the ocean, the earth's temperature takes a long time to reach a new equilibrium after a change in radiative forcing. The model parameters that control heat transport and final change in global mean temperature calibrated to reproduce the results of 19 Global Circulation Models of AR4 (Meinshausen et al., 2011b). In addition, a medium parameterisation is available, which results in behaviour that represents the mean of these 19 model emulations.
Downscaling
The global mean temperature change from MAGICC, and maps of temperature and precipitation change are used in a pattern scaling, to derive spatially explicit temperature and precipitation changes used in other IMAGE components (carbon cycle, crop model, hydrology, nutrients).
Grid-specific temperature and precipitation changes at the end of the century (2071–2100 compared to 1961–1990) from AR4 AOGCM model results (IPCC-DDC, 2007) are linearly interpolated based on the MAGGICs global mean temperature change at a certain time step, and the global mean temperature change corresponding to this map. For future calculations, the results of AR5 should be used to update the MAGICC parameterisation for all available AOGCMs, and to update the gridded patterns of climate change.