Forest management/Description: Difference between revisions
No edit summary |
Dafnomilii (talk | contribs) No edit summary |
||
| (17 intermediate revisions by 5 users not shown) | |||
| Line 1: | Line 1: | ||
{{ComponentDescriptionTemplate | {{ComponentDescriptionTemplate | ||
| | |Reference=Kallio et al., 2004;FAO, 2001a;FAO, 2008;Brown, 2000;Carle and Holmgren, 2008;FAO, 2012b;FAO, 2015;Doelman et al., 2019;Dagnachew et al., 2020;ESA, 2017;FAO, 2020 | ||
}} | |||
<div class="page_standard"> | |||
The forest management module describes regional timber demand and the production of timber in the three different management systems clear felling, selective felling and forest plantations. Deforestation rates reported by {{abbrTemplate|FAO}} and double-checked by satellite-based estimates from ESA-CCI land cover data ([[ESA, 2017]]) are used to calibrate deforestation rates in IMAGE, using a so-called additional deforestation factor resulting in additional degraded forest area. | |||
=== | ===Timber demand=== | ||
In IMAGE 3.2, the driver for forest harvest is timber demand per region. Timber demand is the sum of domestic and/or regional demand and timber claims by other regions (export/trade). Production and trade assumptions for saw logs and paper/pulp wood are based on simple historical relationships between population, GDP and timber use per capita ([[Doelman et al., 2018]]). Domestic demand for fuelwood is based on the [[TIMER model]] (See Component [[Energy supply and demand]]) ([[Dagnachew et al., 2020]]). | |||
Part of the global energy supply is met by fuelwood and charcoal, in particular in less developed world regions. Not all wood involved is produced from formal forestry activities, as it is also collected from non-forest areas, for example from thinning orchards and along roadsides ([[FAO, 2001a]]; [[FAO, 2008]]). As few reliable data are available on fuelwood production, own assumptions have been made in IMAGE. While fuelwood production in industrialized regions is dominated by large-scale, commercial operations, in transitional and developing regions smaller proportions of fuelwood volumes are assumed to come from forestry operations: 50% and 32% respectively. | |||
Part of the global energy | |||
=== | ===Timber supply & production in forests=== | ||
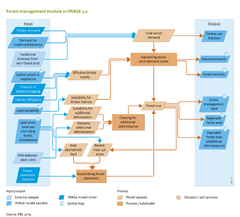
In IMAGE, felling in each region follows a stepwise procedure until timber demand is met, attributed to the three management systems. The proportion for each management system is derived from forest inventories for different world regions ([[Arets et al., 2011]]) and used as model input (Figure Flowchart). Firstly, timber is derived from forest land that has been converted to agriculture. Secondly, timber from forest plantations at the end of their rotation cycle are harvested. Finally, trees from natural forests are harvested, applying clear felling and/or selective felling. In all management systems, trees can only be harvested when the rotation cycle of forest regrowth has been completed. | |||
=== | ===Selective logging=== | ||
Under selective felling, only a - regional and time specific- fraction of the trees is logged and the other trees remain in the forest. After logging, a fraction of the harvested wood is removed from the forest to fulfil the demand. Biomass left behind in the forest represents losses/residues during tree harvesting (from tree damage and unusable tree parts) or left in the forest because of environmental concerns (biodiversity and nutrient supply). This fraction take-away is derived from literature, defined for industrial roundwood (see [[Arets et al., 2011]]) It is further adjusted to account for the demand for wood fuel, for which it equals unity. | |||
===Forest plantations=== | |||
Forest plantations are established for efficient, commercially viable wood production. Their regional establishment in IMAGE 3 is scenario driven (see also Input/Output Table at [[Forest management|Introduction part]]), based on FAO. The expectation is that increasingly more wood will be produced in plantations because sustainability criteria may limit harvest from natural forests ([[Brown, 2000]]; [[Carle and Holmgren, 2008]]; [[FAO, 2012b]]). Forest plantations are assumed to be established firstly on abandoned agricultural land. When sufficient abandoned land is not available, forest plantations are established on cleared forest areas. When a forest plantation has been established, the land cannot be used for other purposes or converted to natural vegetation until the tree rotation cycle has been completed. Forest growth rates are modelled in LPJmL and calibrated to empirical data ([[Braakhekke et al., 2019]]). | |||
===Additional deforestation === | |||
Globally, conversion to agricultural land is the major driver of forest clearing; timber harvest does not result in deforestation, if natural vegetation is regrowing. But there are other causes of deforestation not related to food demand and timber production, such as urbanization, mining and illegal logging. These activities contribute to loss of forest area, increased degradation risks and a decline in the supply of forest services. To account for this, deforestation rates are calibrated to FAO reported deforestation rates that are consistent with observed deforestation from satellite-based land cover time series from ESA-CCI ([[ESA, 2017]]). The additional category used for this calibration is called ‘additional deforestation’. IMAGE assumes no recovery of natural vegetation in these areas and no agricultural activities. | |||
</div> | |||
Latest revision as of 19:14, 22 November 2021
Parts of Forest management/Description
| Component is implemented in: |
| Components: |
| Related IMAGE components |
| Projects/Applications |
| Key publications |
| References |
Model description of Forest management
The forest management module describes regional timber demand and the production of timber in the three different management systems clear felling, selective felling and forest plantations. Deforestation rates reported by FAO and double-checked by satellite-based estimates from ESA-CCI land cover data (ESA, 2017) are used to calibrate deforestation rates in IMAGE, using a so-called additional deforestation factor resulting in additional degraded forest area.
Timber demand
In IMAGE 3.2, the driver for forest harvest is timber demand per region. Timber demand is the sum of domestic and/or regional demand and timber claims by other regions (export/trade). Production and trade assumptions for saw logs and paper/pulp wood are based on simple historical relationships between population, GDP and timber use per capita (Doelman et al., 2018). Domestic demand for fuelwood is based on the TIMER model (See Component Energy supply and demand) (Dagnachew et al., 2020).
Part of the global energy supply is met by fuelwood and charcoal, in particular in less developed world regions. Not all wood involved is produced from formal forestry activities, as it is also collected from non-forest areas, for example from thinning orchards and along roadsides (FAO, 2001a; FAO, 2008). As few reliable data are available on fuelwood production, own assumptions have been made in IMAGE. While fuelwood production in industrialized regions is dominated by large-scale, commercial operations, in transitional and developing regions smaller proportions of fuelwood volumes are assumed to come from forestry operations: 50% and 32% respectively.
Timber supply & production in forests
In IMAGE, felling in each region follows a stepwise procedure until timber demand is met, attributed to the three management systems. The proportion for each management system is derived from forest inventories for different world regions (Arets et al., 2011) and used as model input (Figure Flowchart). Firstly, timber is derived from forest land that has been converted to agriculture. Secondly, timber from forest plantations at the end of their rotation cycle are harvested. Finally, trees from natural forests are harvested, applying clear felling and/or selective felling. In all management systems, trees can only be harvested when the rotation cycle of forest regrowth has been completed.
Selective logging
Under selective felling, only a - regional and time specific- fraction of the trees is logged and the other trees remain in the forest. After logging, a fraction of the harvested wood is removed from the forest to fulfil the demand. Biomass left behind in the forest represents losses/residues during tree harvesting (from tree damage and unusable tree parts) or left in the forest because of environmental concerns (biodiversity and nutrient supply). This fraction take-away is derived from literature, defined for industrial roundwood (see Arets et al., 2011) It is further adjusted to account for the demand for wood fuel, for which it equals unity.
Forest plantations
Forest plantations are established for efficient, commercially viable wood production. Their regional establishment in IMAGE 3 is scenario driven (see also Input/Output Table at Introduction part), based on FAO. The expectation is that increasingly more wood will be produced in plantations because sustainability criteria may limit harvest from natural forests (Brown, 2000; Carle and Holmgren, 2008; FAO, 2012b). Forest plantations are assumed to be established firstly on abandoned agricultural land. When sufficient abandoned land is not available, forest plantations are established on cleared forest areas. When a forest plantation has been established, the land cannot be used for other purposes or converted to natural vegetation until the tree rotation cycle has been completed. Forest growth rates are modelled in LPJmL and calibrated to empirical data (Braakhekke et al., 2019).
Additional deforestation
Globally, conversion to agricultural land is the major driver of forest clearing; timber harvest does not result in deforestation, if natural vegetation is regrowing. But there are other causes of deforestation not related to food demand and timber production, such as urbanization, mining and illegal logging. These activities contribute to loss of forest area, increased degradation risks and a decline in the supply of forest services. To account for this, deforestation rates are calibrated to FAO reported deforestation rates that are consistent with observed deforestation from satellite-based land cover time series from ESA-CCI (ESA, 2017). The additional category used for this calibration is called ‘additional deforestation’. IMAGE assumes no recovery of natural vegetation in these areas and no agricultural activities.