Human development: Difference between revisions
No edit summary |
Oostenrijr (talk | contribs) m (Text replacement - "==Introduction==" to "") |
||
| (69 intermediate revisions by 5 users not shown) | |||
| Line 1: | Line 1: | ||
{{ComponentTemplate2 | {{ComponentTemplate2 | ||
| | |Application=OECD Environmental Outlook to 2050 (2012) project; Roads from Rio+20 (2012) project; Beyond 2015 (2009) project; | ||
| | |IMAGEComponent=Drivers; Energy demand; Agricultural economy; Emissions; Water | ||
|InputVar=Temperature | |Model-Database=GUAM model; World Bank database; FAOSTAT database; WHO database; | ||
|OutputVar= | |KeyReference=Hilderink and Lucas, 2008; PBL, 2012; PBL, 2009; | ||
|InputVar=Temperature - grid; Precipitation - grid; Food availability per capita; GINI coefficient; GDP per capita; People dependent on solid fuel; BC, OC and NOx emissions; SO2 emissions; Population - grid; Urban population fraction; | |||
|OutputVar=Child mortality; Life expectancy; DALYs (disability-adjusted life years); Access to drinking water and sanitation; HDI (human development index); Child underweight; Prevalence of undernourishment; People living on less then USD 1.25 per day; | |||
|ComponentCode=HD | |||
|AggregatedComponent=Impacts | |||
|FrameworkElementType=impact component | |FrameworkElementType=impact component | ||
}} | |||
<div class="page_standard"> | |||
The | The quantity and quality of accessible environmental resources determine the viability of livelihoods. Unequal access to, and diminished quality of resources have a significant effect on livelihoods and on human health, particularly in developing countries. Increasing world population accompanied by rising demand for food, water and energy will put even more pressure on scarce natural resources, such as fertile land, potable water and forest resources. The pressure will be even greater in areas where natural resources are not well managed and or where degraded as a result of global environmental change. | ||
On all scales from global UN processes to local initiatives, decision makers are concerned with improving the standard of living and human development. The IMAGE framework provides valuable insights into key environmental factors that affect human development, and how these impacts may be reduced by improving the natural environment. | |||
}} | |||
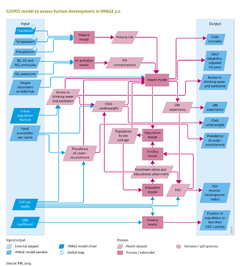
In the IMAGE framework, the Global Integrated Sustainability Model ([[GISMO model|GISMO]]) quantifies changes in human development, including access to food, water and energy, and the impact of economic, social and environmental changes (Hilderink and Lucas, 2008). The model includes the Human Development Index (HDI), population health measures (e.g. child mortality and life expectancy), and many indicators for the Millennium Development Goals ({{abbrTemplate|MDGs}}). | |||
Those parts of GISMO directly linked to other parts of IMAGE, are namely climate-related health risks, health problems related to urban and indoor air pollution, and the effects of malnutrition. | |||
{{InputOutputParameterTemplate}} | |||
</div> | |||
Latest revision as of 15:24, 1 April 2020
Parts of Human development
| Component is implemented in: |
|
| Related IMAGE components |
| Projects/Applications |
| Models/Databases |
| Key publications |
Key policy issues
- What are the key future trends in human development, such as those targeted by the Millennium Development Goals (MDGs)?
- How are changes in the global environment likely to affect human development?
- How is improved access to food, water and energy likely to contribute to human development?
Introduction
The quantity and quality of accessible environmental resources determine the viability of livelihoods. Unequal access to, and diminished quality of resources have a significant effect on livelihoods and on human health, particularly in developing countries. Increasing world population accompanied by rising demand for food, water and energy will put even more pressure on scarce natural resources, such as fertile land, potable water and forest resources. The pressure will be even greater in areas where natural resources are not well managed and or where degraded as a result of global environmental change.
On all scales from global UN processes to local initiatives, decision makers are concerned with improving the standard of living and human development. The IMAGE framework provides valuable insights into key environmental factors that affect human development, and how these impacts may be reduced by improving the natural environment.
In the IMAGE framework, the Global Integrated Sustainability Model (GISMO) quantifies changes in human development, including access to food, water and energy, and the impact of economic, social and environmental changes (Hilderink and Lucas, 2008). The model includes the Human Development Index (HDI), population health measures (e.g. child mortality and life expectancy), and many indicators for the Millennium Development Goals (MDGs).
Those parts of GISMO directly linked to other parts of IMAGE, are namely climate-related health risks, health problems related to urban and indoor air pollution, and the effects of malnutrition.
Input/Output Table
Input Human development component
| IMAGE model drivers and variables | Description | Source |
|---|---|---|
| GINI coefficient | Measure of income disparity in a population. If all have the same income, GINI equals 1. The lower the GINI, the wider the gap between the lowest and highest income groups. | Drivers |
| Population - grid | Number of people per gridcell (using downscaling). | Drivers |
| Urban population fraction | Urban/rural split of population. | Drivers |
| GDP per capita | Gross Domestic Product per capita, measured as the market value of all goods and services produced in a region in a year, and is used in the IMAGE framework as a generic indicator of economic activity. | Drivers |
| Precipitation - grid | Monthly total precipitation. | Atmospheric composition and climate |
| Food availability per capita | Food availability per capita. | Agricultural economy |
| People dependent on solid fuel | Proportion of population using traditional biomass and coal for cooking and heating. | Energy demand |
| BC, OC and NOx emissions | Emissions of BC, OC and NOx per year. | Emissions |
| SO2 emissions | SO2 emissions, per source (e.g. fossil fuel burning, deforestation). | Emissions |
| Temperature - grid | Monthly average temperature. | Atmospheric composition and climate |
Output Human development component
| IMAGE model variables | Description | Use |
|---|---|---|
| Prevalence of undernourishment | Proportion of the population with insufficient food intake to meet dietary energy requirements. | Final output |
| Life expectancy | Average life expectancy of a person born in a given year.. | Final output |
| People living on less then USD 1.25 per day | People living on less than $1.25 a day. | Final output |
| DALYs (disability-adjusted life years) | The disability-adjusted life year (DALY) is a measure of overall disease burden, expressed as the number of years lost due to ill-health, disability and early death. | Final output |
| Access to drinking water and sanitation | Percentage of the population with sustainable access to safe drinking water and basic sanitation. | Final output |
| HDI (human development index) | HDI: Development level of a country based on income, education and life expectancy. | Final output |
| Child underweight | Prevalence of undernourishment in children. | Final output |
| Child mortality | he probability per 1,000 that a new-born baby will die before reaching the age five, if subject to average age-specific mortality rates. | Final output |